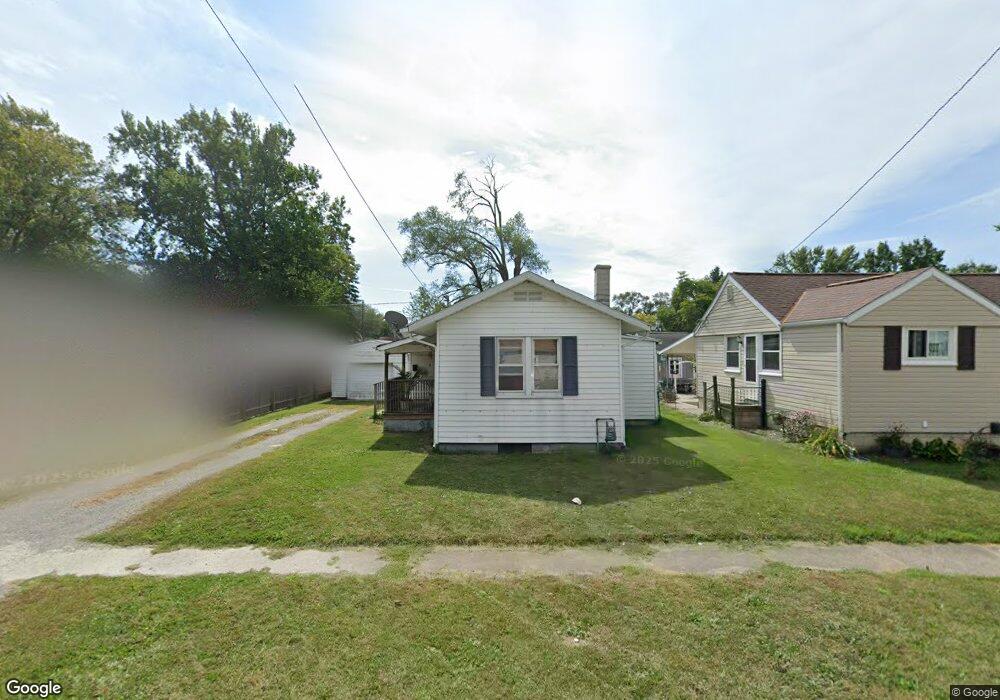
609 E Foulke Ave Findlay, OH 45840
Estimated Value: $87,000 - $154,000
2
Beds
1
Bath
712
Sq Ft
$173/Sq Ft
Est. Value
About This Home
This home is located at 609 E Foulke Ave, Findlay, OH 45840 and is currently estimated at $123,493, approximately $173 per square foot. 609 E Foulke Ave is a home located in Hancock County with nearby schools including Whittier Primary School, Bigelow Hill Elementary School, and Glenwood Middle School.
Ownership History
Date
Name
Owned For
Owner Type
Purchase Details
Closed on
Aug 6, 2020
Sold by
Ogg Ryan M
Bought by
Accord Proiperty Management Llc
Current Estimated Value
Purchase Details
Closed on
Jan 11, 2010
Sold by
Us Bank National Association
Bought by
Ogg Ryan
Purchase Details
Closed on
Dec 17, 2009
Sold by
Stauffer Jason J
Bought by
Us Bank National Association
Purchase Details
Closed on
Sep 24, 2003
Sold by
Ryan Rebecca K and Ryan Marie K
Bought by
Stauffer Jason J
Home Financials for this Owner
Home Financials are based on the most recent Mortgage that was taken out on this home.
Original Mortgage
$49,500
Interest Rate
6.25%
Mortgage Type
Purchase Money Mortgage
Purchase Details
Closed on
Aug 14, 1997
Sold by
Smith Stephen
Bought by
Ryan Rebecca and Ryan Marie
Home Financials for this Owner
Home Financials are based on the most recent Mortgage that was taken out on this home.
Original Mortgage
$2,500
Interest Rate
7.71%
Mortgage Type
New Conventional
Purchase Details
Closed on
Jun 29, 1992
Bought by
Smith Stephen A
Purchase Details
Closed on
May 28, 1982
Bought by
Shepard Francis
Purchase Details
Closed on
Nov 6, 1981
Bought by
Keel Donald
Create a Home Valuation Report for This Property
The Home Valuation Report is an in-depth analysis detailing your home's value as well as a comparison with similar homes in the area
Home Values in the Area
Average Home Value in this Area
Purchase History
| Date | Buyer | Sale Price | Title Company |
|---|---|---|---|
| Accord Proiperty Management Llc | -- | None Available | |
| Ogg Ryan | $24,000 | Rel Title Brittany | |
| Us Bank National Association | $14,667 | None Available | |
| Stauffer Jason J | $49,500 | Mid Am Title | |
| Ryan Rebecca | $43,900 | -- | |
| Smith Stephen A | $26,000 | -- | |
| Shepard Francis | $15,000 | -- | |
| Keel Donald | -- | -- |
Source: Public Records
Mortgage History
| Date | Status | Borrower | Loan Amount |
|---|---|---|---|
| Previous Owner | Stauffer Jason J | $49,500 | |
| Previous Owner | Ryan Rebecca | $2,500 |
Source: Public Records
Tax History
| Year | Tax Paid | Tax Assessment Tax Assessment Total Assessment is a certain percentage of the fair market value that is determined by local assessors to be the total taxable value of land and additions on the property. | Land | Improvement |
|---|---|---|---|---|
| 2024 | $1,037 | $28,450 | $4,660 | $23,790 |
| 2023 | $1,039 | $28,450 | $4,660 | $23,790 |
| 2022 | $1,035 | $28,450 | $4,660 | $23,790 |
| 2021 | $826 | $19,780 | $4,660 | $15,120 |
| 2020 | $826 | $19,780 | $4,660 | $15,120 |
| 2019 | $810 | $19,780 | $4,660 | $15,120 |
| 2018 | $731 | $16,390 | $4,240 | $12,150 |
| 2017 | $732 | $16,390 | $4,240 | $12,150 |
| 2016 | $734 | $16,390 | $4,240 | $12,150 |
| 2015 | $738 | $16,420 | $4,620 | $11,800 |
| 2014 | $739 | $16,420 | $4,620 | $11,800 |
| 2012 | $745 | $16,420 | $4,620 | $11,800 |
Source: Public Records
Map
Nearby Homes
- 322 Midland Ave
- 301 Allen Ave
- 1062 Vincent St
- 1820 Gayle Ln
- 716 Winfield Ave
- 912 Parkside Place
- 206 Midland Ave
- 0 Sheridan Ave
- 1725 Parkside Place
- 1030 Sheridan Ave
- 1142 Concord Ct
- 741 Central Ave
- 1216 Concord Ct
- 828 N Hill Trail
- 810 Mcconnell St
- 1108 Glen Meadow Dr
- 626 Central Ave
- 0 E Melrose Ave
- 1209 Heather Dr
- 1125 Glen Meadow Dr
- 607 E Foulke Ave
- 615 E Foulke Ave
- 601 E Foulke Ave
- 617 E Foulke Ave
- 525 E Foulke Ave
- 912 Crystal Ave
- 908 Crystal Ave
- 602 Allen Ave
- 910 Crystal Ave
- 600 Allen Ave
- 920 Crystal Ave
- 904 Crystal Ave
- 608 E Foulke Ave
- 519 E Foulke Ave
- 604 E Foulke Ave
- 612 E Foulke Ave
- 916 Crystal Ave
- 600 E Foulke Ave
- 616 E Foulke Ave
- 608 Allen Ave
Your Personal Tour Guide
Ask me questions while you tour the home.