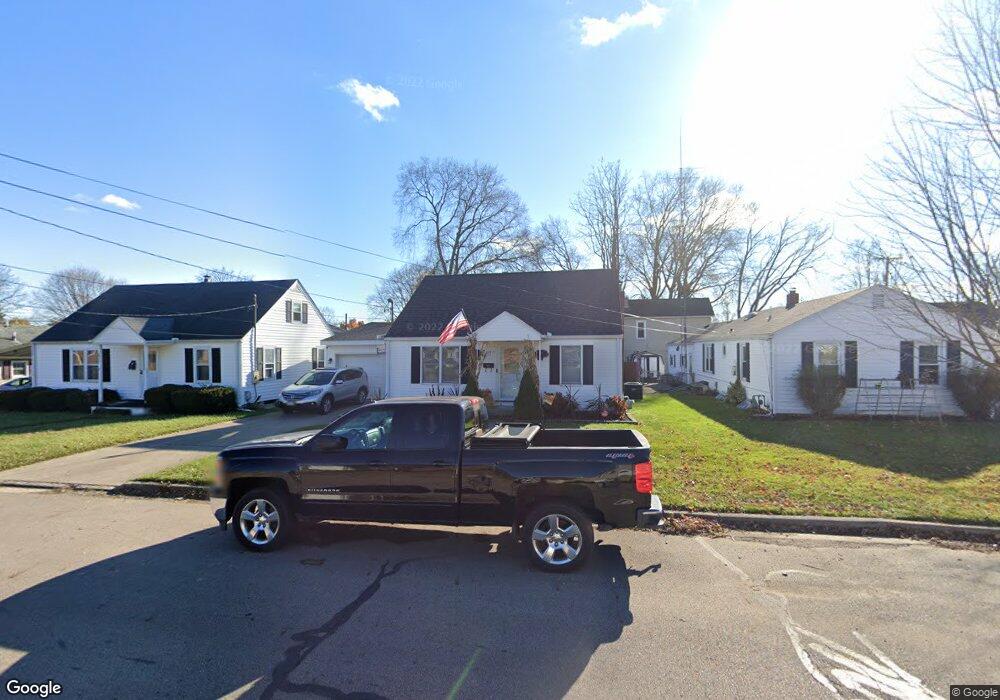
609 E Ward St Urbana, OH 43078
Estimated Value: $204,000 - $229,000
2
Beds
2
Baths
1,400
Sq Ft
$155/Sq Ft
Est. Value
About This Home
This home is located at 609 E Ward St, Urbana, OH 43078 and is currently estimated at $216,643, approximately $154 per square foot. 609 E Ward St is a home located in Champaign County with nearby schools including Urbana Elementary School, Urbana High School, and Urbana Community School.
Ownership History
Date
Name
Owned For
Owner Type
Purchase Details
Closed on
Mar 16, 2011
Sold by
Mcintire Peggy
Bought by
Pryor Brandon M and Wellbaum Sarah B
Current Estimated Value
Home Financials for this Owner
Home Financials are based on the most recent Mortgage that was taken out on this home.
Original Mortgage
$60,585
Outstanding Balance
$42,211
Interest Rate
5.09%
Mortgage Type
New Conventional
Estimated Equity
$174,432
Purchase Details
Closed on
Apr 23, 2003
Sold by
Obrien J Terrence and Obrien Joann R
Bought by
Mcintire Peggy
Home Financials for this Owner
Home Financials are based on the most recent Mortgage that was taken out on this home.
Original Mortgage
$48,000
Interest Rate
5.86%
Mortgage Type
Purchase Money Mortgage
Purchase Details
Closed on
Aug 1, 1996
Sold by
Zerkle Charles R
Bought by
O'Brien Terrance J and O'Brien R J
Home Financials for this Owner
Home Financials are based on the most recent Mortgage that was taken out on this home.
Original Mortgage
$65,600
Interest Rate
7.25%
Mortgage Type
New Conventional
Create a Home Valuation Report for This Property
The Home Valuation Report is an in-depth analysis detailing your home's value as well as a comparison with similar homes in the area
Home Values in the Area
Average Home Value in this Area
Purchase History
| Date | Buyer | Sale Price | Title Company |
|---|---|---|---|
| Pryor Brandon M | $51,000 | Attorney | |
| Mcintire Peggy | $95,000 | -- | |
| O'Brien Terrance J | $82,000 | -- |
Source: Public Records
Mortgage History
| Date | Status | Borrower | Loan Amount |
|---|---|---|---|
| Open | Pryor Brandon M | $60,585 | |
| Closed | Mcintire Peggy | $48,000 | |
| Previous Owner | O'Brien Terrance J | $65,600 |
Source: Public Records
Tax History Compared to Growth
Tax History
| Year | Tax Paid | Tax Assessment Tax Assessment Total Assessment is a certain percentage of the fair market value that is determined by local assessors to be the total taxable value of land and additions on the property. | Land | Improvement |
|---|---|---|---|---|
| 2024 | $1,926 | $46,840 | $3,050 | $43,790 |
| 2023 | $1,926 | $46,840 | $3,050 | $43,790 |
| 2022 | $1,966 | $46,840 | $3,050 | $43,790 |
| 2021 | $1,712 | $36,170 | $2,440 | $33,730 |
| 2020 | $1,712 | $36,170 | $2,440 | $33,730 |
| 2019 | $1,691 | $36,170 | $2,440 | $33,730 |
| 2018 | $1,633 | $33,380 | $2,000 | $31,380 |
| 2017 | $1,622 | $33,380 | $2,000 | $31,380 |
| 2016 | $1,625 | $33,380 | $2,000 | $31,380 |
| 2015 | $1,600 | $31,890 | $2,000 | $29,890 |
| 2014 | $1,602 | $31,890 | $2,000 | $29,890 |
| 2013 | $1,363 | $31,890 | $2,000 | $29,890 |
Source: Public Records
Map
Nearby Homes