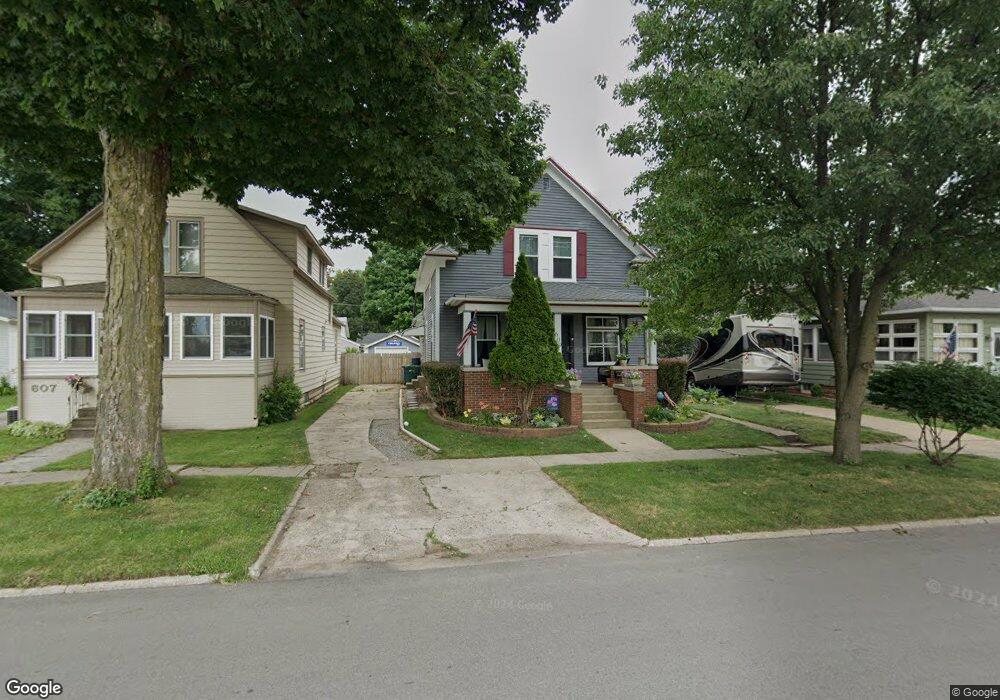
609 F St La Porte, IN 46350
Estimated Value: $173,000 - $239,000
3
Beds
2
Baths
1,846
Sq Ft
$110/Sq Ft
Est. Value
About This Home
This home is located at 609 F St, La Porte, IN 46350 and is currently estimated at $202,683, approximately $109 per square foot. 609 F St is a home located in LaPorte County with nearby schools including Dunkerton Elementary School, La Porte High School, and Handley Elementary School.
Ownership History
Date
Name
Owned For
Owner Type
Purchase Details
Closed on
Oct 6, 2022
Sold by
Sime Andrew
Bought by
Amigon Fidelito and Amigon Kelly L
Current Estimated Value
Home Financials for this Owner
Home Financials are based on the most recent Mortgage that was taken out on this home.
Original Mortgage
$165,420
Outstanding Balance
$159,015
Interest Rate
5.89%
Mortgage Type
New Conventional
Estimated Equity
$43,668
Purchase Details
Closed on
May 16, 2022
Sold by
Park Billie J and Park Adah E
Bought by
Sime Andrew
Create a Home Valuation Report for This Property
The Home Valuation Report is an in-depth analysis detailing your home's value as well as a comparison with similar homes in the area
Home Values in the Area
Average Home Value in this Area
Purchase History
| Date | Buyer | Sale Price | Title Company |
|---|---|---|---|
| Amigon Fidelito | -- | Fidelity National Title | |
| Sime Andrew | -- | Fidelity National Title |
Source: Public Records
Mortgage History
| Date | Status | Borrower | Loan Amount |
|---|---|---|---|
| Open | Amigon Fidelito | $165,420 |
Source: Public Records
Tax History Compared to Growth
Tax History
| Year | Tax Paid | Tax Assessment Tax Assessment Total Assessment is a certain percentage of the fair market value that is determined by local assessors to be the total taxable value of land and additions on the property. | Land | Improvement |
|---|---|---|---|---|
| 2024 | $1,475 | $152,800 | $14,600 | $138,200 |
| 2023 | $1,396 | $139,600 | $12,200 | $127,400 |
| 2022 | $1,259 | $125,900 | $12,200 | $113,700 |
| 2021 | $1,179 | $117,900 | $12,200 | $105,700 |
| 2020 | $1,113 | $117,900 | $12,200 | $105,700 |
| 2019 | $1,161 | $111,300 | $14,600 | $96,700 |
| 2018 | $1,066 | $101,800 | $12,800 | $89,000 |
| 2017 | $1,010 | $96,200 | $12,800 | $83,400 |
| 2016 | $929 | $103,600 | $12,800 | $90,800 |
| 2014 | $940 | $94,000 | $12,800 | $81,200 |
Source: Public Records
Map
Nearby Homes