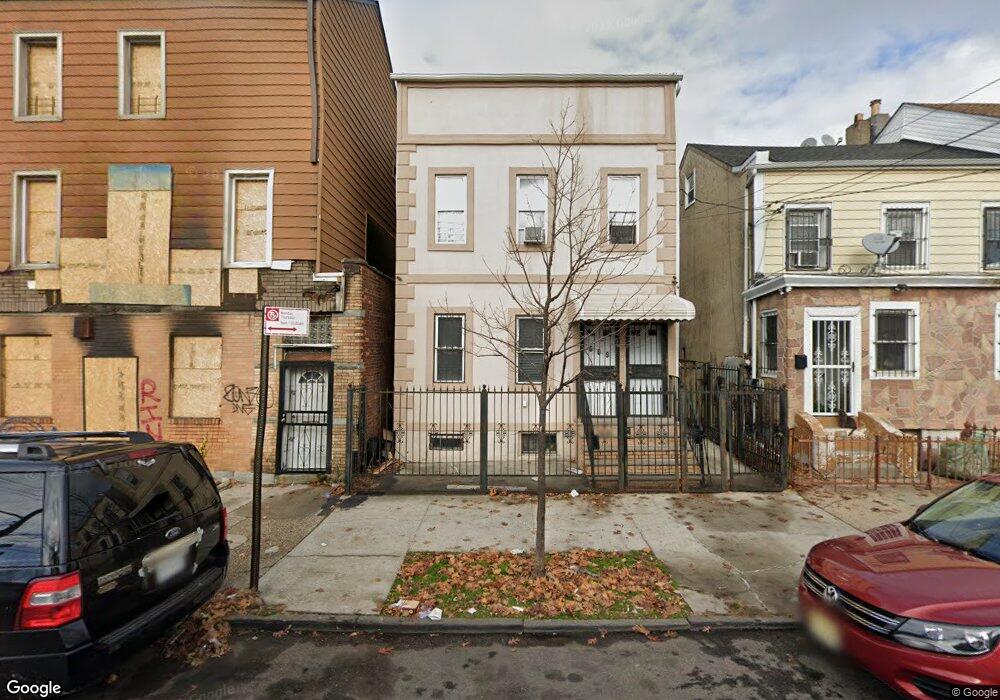
609 Glenmore Ave Brooklyn, NY 11207
East New York NeighborhoodEstimated Value: $638,964 - $1,171,000
--
Bed
--
Bath
1,384
Sq Ft
$626/Sq Ft
Est. Value
About This Home
This home is located at 609 Glenmore Ave, Brooklyn, NY 11207 and is currently estimated at $866,741, approximately $626 per square foot. 609 Glenmore Ave is a home located in Kings County with nearby schools including P.S. 158 Warwick, J.H.S 292 Margaret S. Douglas, and Achievement First Apollo Charter School.
Ownership History
Date
Name
Owned For
Owner Type
Purchase Details
Closed on
May 22, 2013
Sold by
Lakewood Building Corp
Bought by
Beltre Sandy and Beltre Yonaivi
Current Estimated Value
Home Financials for this Owner
Home Financials are based on the most recent Mortgage that was taken out on this home.
Original Mortgage
$436,939
Outstanding Balance
$307,299
Interest Rate
3.39%
Mortgage Type
New Conventional
Estimated Equity
$559,442
Purchase Details
Closed on
Dec 30, 2011
Sold by
Bruce L Stein Public Administrator Of and County As Administrator
Bought by
Lakewood Building Corp
Purchase Details
Closed on
Dec 22, 2006
Sold by
Tycoon Collection Inc
Bought by
Lakewood Building Corp
Purchase Details
Closed on
Aug 11, 2006
Sold by
Tycoon Burnell
Bought by
Tycoon Collections Inc
Purchase Details
Closed on
Jul 24, 2006
Sold by
Scott Oscar
Bought by
Tycoon Burnell
Purchase Details
Closed on
Jul 20, 2006
Sold by
Sgambati Patricia R
Bought by
112-40 F L B Corp
Purchase Details
Closed on
Jan 20, 2006
Sold by
Sgambati Miriam J
Bought by
Scott Oscar
Create a Home Valuation Report for This Property
The Home Valuation Report is an in-depth analysis detailing your home's value as well as a comparison with similar homes in the area
Home Values in the Area
Average Home Value in this Area
Purchase History
| Date | Buyer | Sale Price | Title Company |
|---|---|---|---|
| Beltre Sandy | $445,000 | -- | |
| Beltre Sandy | $445,000 | -- | |
| Lakewood Building Corp | $76,050 | -- | |
| Lakewood Building Corp | $76,050 | -- | |
| Lakewood Building Corp | $208,000 | -- | |
| Lakewood Building Corp | $208,000 | -- | |
| Tycoon Collections Inc | $37,000 | -- | |
| Tycoon Collections Inc | $37,000 | -- | |
| Tycoon Burnell | $27,000 | -- | |
| Tycoon Burnell | $27,000 | -- | |
| 112-40 F L B Corp | $2,000 | -- | |
| 112-40 F L B Corp | $2,000 | -- | |
| Scott Oscar | -- | -- | |
| Scott Oscar | -- | -- |
Source: Public Records
Mortgage History
| Date | Status | Borrower | Loan Amount |
|---|---|---|---|
| Open | Beltre Sandy | $436,939 | |
| Closed | Beltre Sandy | $436,939 |
Source: Public Records
Tax History Compared to Growth
Tax History
| Year | Tax Paid | Tax Assessment Tax Assessment Total Assessment is a certain percentage of the fair market value that is determined by local assessors to be the total taxable value of land and additions on the property. | Land | Improvement |
|---|---|---|---|---|
| 2025 | $2,876 | $46,920 | $12,900 | $34,020 |
| 2024 | $2,876 | $37,080 | $12,900 | $24,180 |
| 2023 | $2,743 | $45,480 | $12,900 | $32,580 |
| 2022 | $2,604 | $37,200 | $12,900 | $24,300 |
| 2021 | $2,654 | $28,740 | $12,900 | $15,840 |
| 2020 | $1,318 | $31,740 | $12,900 | $18,840 |
| 2019 | $2,496 | $31,740 | $12,900 | $18,840 |
| 2018 | $2,295 | $11,257 | $5,261 | $5,996 |
| 2017 | $2,215 | $10,868 | $5,216 | $5,652 |
| 2016 | $2,101 | $10,509 | $4,737 | $5,772 |
| 2015 | $1,237 | $10,495 | $4,222 | $6,273 |
| 2014 | $1,237 | $9,943 | $4,575 | $5,368 |
Source: Public Records
Map
Nearby Homes
- 597 Liberty Ave
- 323 Barbey St
- 599 Liberty Ave
- 633 Glenmore Ave
- 202 Schenck Ave
- 303 Hendrix St
- 278 Ashford St
- 2825 Atlantic Ave
- 576 Glenmore Ave
- 572 Glenmore Ave
- 389 Warwick St
- 295 Ashford St
- 253 Ashford St
- 2321 Pitkin Ave
- 221 Barbey St
- 396 Barbey St
- 174 van Siclen Ave
- 279 van Siclen Ave
- 2830 Fulton St
- 374 Ashford St
- 605 Glenmore Ave
- 611 Glenmore Ave
- 613 Glenmore Ave
- 615 Glenmore Ave
- 329 Barbey St
- 336 Barbey St
- 617 Glenmore Ave
- 327 Barbey St
- 599 Glenmore Ave
- 599 Glenmore Ave Unit 2floor
- 286 Jerome St
- 284 Jerome St
- 334 Barbey St
- 597 Glenmore Ave
- 608 Glenmore Ave
- 321A Barbey St
- 321A Barbey St Unit 1
- 610 Glenmore Ave
- 282 Jerome St
- 616 Glenmore Ave