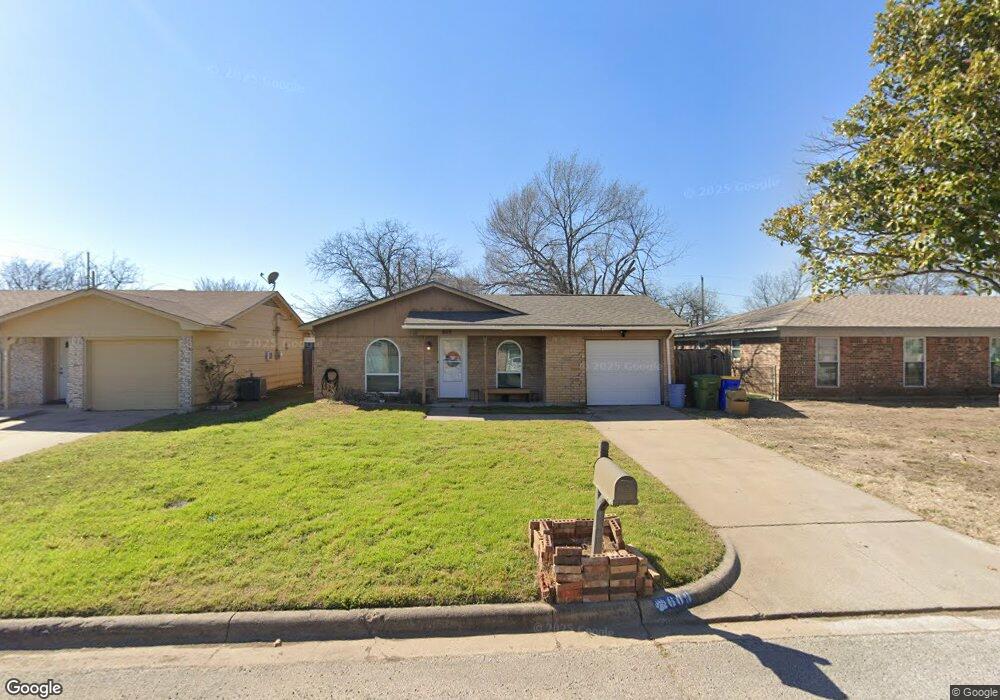
609 Hallvale Dr Fort Worth, TX 76108
Estimated Value: $204,000 - $233,000
3
Beds
2
Baths
1,046
Sq Ft
$202/Sq Ft
Est. Value
About This Home
This home is located at 609 Hallvale Dr, Fort Worth, TX 76108 and is currently estimated at $211,756, approximately $202 per square foot. 609 Hallvale Dr is a home located in Tarrant County with nearby schools including North Elementary School, Brewer Middle School, and Tannahill Intermediate School.
Ownership History
Date
Name
Owned For
Owner Type
Purchase Details
Closed on
Oct 7, 2021
Sold by
Ebh Investments Llc
Bought by
Pwt Investments Llc
Current Estimated Value
Purchase Details
Closed on
Jul 28, 2003
Sold by
Reese Stephanie L
Bought by
Alvizo Jose D and Alvizo Carrie E
Home Financials for this Owner
Home Financials are based on the most recent Mortgage that was taken out on this home.
Original Mortgage
$73,440
Interest Rate
5.19%
Mortgage Type
Purchase Money Mortgage
Purchase Details
Closed on
Jun 10, 1998
Sold by
Fogle Patricia Ann and Wilkinson Joseph R
Bought by
Reese Stephanie L
Home Financials for this Owner
Home Financials are based on the most recent Mortgage that was taken out on this home.
Original Mortgage
$46,421
Interest Rate
7.21%
Mortgage Type
FHA
Create a Home Valuation Report for This Property
The Home Valuation Report is an in-depth analysis detailing your home's value as well as a comparison with similar homes in the area
Home Values in the Area
Average Home Value in this Area
Purchase History
| Date | Buyer | Sale Price | Title Company |
|---|---|---|---|
| Pwt Investments Llc | -- | Simplified Title Company Llc | |
| Ebb Investments Llc | -- | Simplified Title Company | |
| Alvizo Jose D | -- | Alamo Title Company | |
| Reese Stephanie L | -- | Alamo Title Co |
Source: Public Records
Mortgage History
| Date | Status | Borrower | Loan Amount |
|---|---|---|---|
| Previous Owner | Alvizo Jose D | $73,440 | |
| Previous Owner | Reese Stephanie L | $46,421 |
Source: Public Records
Tax History Compared to Growth
Tax History
| Year | Tax Paid | Tax Assessment Tax Assessment Total Assessment is a certain percentage of the fair market value that is determined by local assessors to be the total taxable value of land and additions on the property. | Land | Improvement |
|---|---|---|---|---|
| 2025 | $3,215 | $147,709 | $34,985 | $112,724 |
| 2024 | $3,215 | $147,709 | $34,985 | $112,724 |
| 2023 | $3,559 | $149,698 | $34,985 | $114,713 |
| 2022 | $3,512 | $129,669 | $25,000 | $104,669 |
| 2021 | $3,206 | $116,537 | $25,000 | $91,537 |
| 2020 | $3,654 | $131,886 | $25,000 | $106,886 |
| 2019 | $3,651 | $126,933 | $25,000 | $101,933 |
| 2018 | $3,239 | $112,604 | $11,000 | $101,604 |
| 2017 | $3,060 | $104,704 | $11,000 | $93,704 |
| 2016 | $2,511 | $85,913 | $11,000 | $74,913 |
| 2015 | $1,732 | $60,300 | $11,000 | $49,300 |
| 2014 | $1,732 | $60,300 | $11,000 | $49,300 |
Source: Public Records
Map
Nearby Homes
- 627 Hallvale Dr
- 8814 Rockway St
- 8814 Clifford St
- 8811 Silver Creek Rd
- 8401 Clifford St
- 9005 Glenn Dr
- 308 Hallvale Dr
- 304 Lockwood St
- 633 Lariat Ln
- 813 Hackamore St
- 813 S Kate St
- 1800 N Las Vegas Trail
- 8133 Foxfire Ln
- 9201 Clifford St
- 8832 Kate St
- 8113 Foxfire Ln
- 8417 Omaha Dr
- 311 Russell St
- 203 East Place
- 201 N Normandale St
- 607 Hallvale Dr
- 611 Hallvale Dr
- 605 Hallvale Dr
- 613 Hallvale Dr
- 612 N Las Vegas Trail
- 610 N Las Vegas Trail
- 608 N Las Vegas Trail
- 612 Hallvale Dr
- 601 Hallvale Dr
- 616 Hallvale Dr
- 608 Hallvale Dr
- 617 Hallvale Dr
- 618 Hallvale Dr
- 604 Hallvale Dr
- 620 Hallvale Dr
- 619 Hallvale Dr
- 8708 Wilbur St
- 622 Hallvale Dr
- 304 Hallvale Dr
- 624 Hallvale Dr