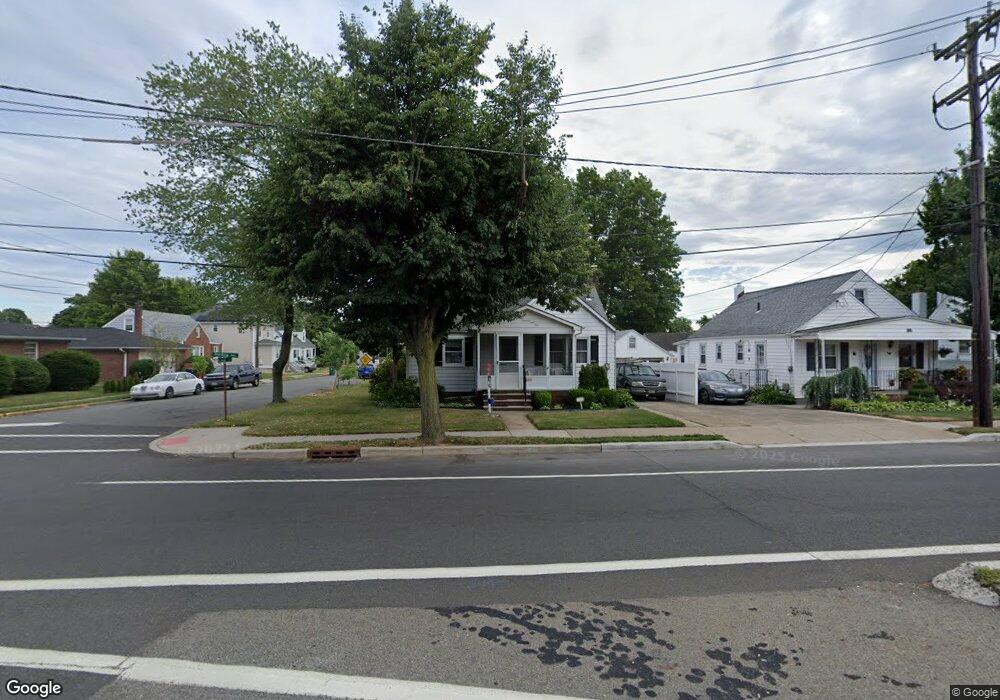
609 Harding Ave Perth Amboy, NJ 08861
Chickentown NeighborhoodEstimated Value: $432,174 - $509,000
--
Bed
--
Bath
1,489
Sq Ft
$320/Sq Ft
Est. Value
About This Home
This home is located at 609 Harding Ave, Perth Amboy, NJ 08861 and is currently estimated at $476,794, approximately $320 per square foot. 609 Harding Ave is a home located in Middlesex County with nearby schools including Perth Amboy High School, Academy for Urban Leadership Charter School, and Assumption Catholic School.
Ownership History
Date
Name
Owned For
Owner Type
Purchase Details
Closed on
Apr 1, 2025
Sold by
Wozniak Edward and Marks Tara
Bought by
Marks Tara and Wozniak Lindsay
Current Estimated Value
Purchase Details
Closed on
Mar 4, 2010
Sold by
Rusin Lillian and Wozniak Edward
Bought by
Wozniak Edward and Rusin Lillian
Purchase Details
Closed on
May 13, 2008
Sold by
Rusin Lillian and Wozniak William
Bought by
Rusin Lillian and Wozniak Edward
Create a Home Valuation Report for This Property
The Home Valuation Report is an in-depth analysis detailing your home's value as well as a comparison with similar homes in the area
Home Values in the Area
Average Home Value in this Area
Purchase History
| Date | Buyer | Sale Price | Title Company |
|---|---|---|---|
| Marks Tara | -- | None Listed On Document | |
| Marks Tara | -- | None Listed On Document | |
| Wozniak Edward | -- | None Available | |
| Rusin Lillian | -- | None Available |
Source: Public Records
Tax History Compared to Growth
Tax History
| Year | Tax Paid | Tax Assessment Tax Assessment Total Assessment is a certain percentage of the fair market value that is determined by local assessors to be the total taxable value of land and additions on the property. | Land | Improvement |
|---|---|---|---|---|
| 2025 | $7,449 | $255,200 | $112,000 | $143,200 |
| 2024 | $7,434 | $255,200 | $112,000 | $143,200 |
| 2023 | $7,434 | $255,200 | $112,000 | $143,200 |
| 2022 | $7,342 | $255,200 | $112,000 | $143,200 |
| 2021 | $6,870 | $255,200 | $112,000 | $143,200 |
| 2020 | $7,350 | $255,200 | $112,000 | $143,200 |
| 2019 | $7,628 | $255,200 | $112,000 | $143,200 |
| 2018 | $7,312 | $255,200 | $112,000 | $143,200 |
| 2017 | $7,296 | $255,200 | $112,000 | $143,200 |
| 2016 | $7,350 | $255,200 | $112,000 | $143,200 |
| 2015 | $7,151 | $255,200 | $112,000 | $143,200 |
| 2014 | $7,197 | $255,200 | $112,000 | $143,200 |
Source: Public Records
Map
Nearby Homes