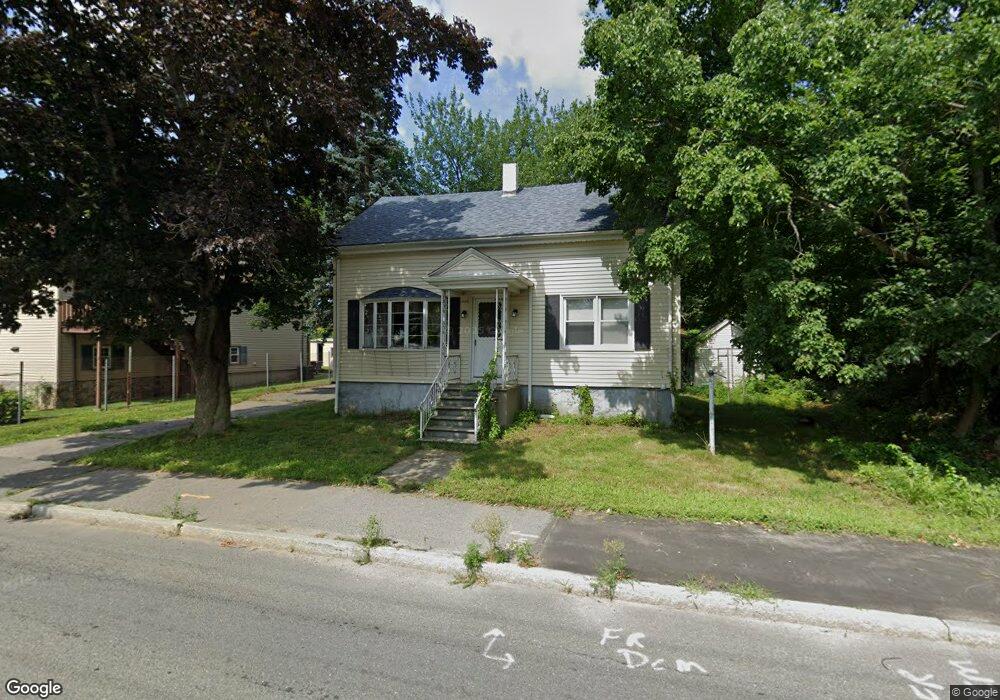
609 Laurel St Fall River, MA 02721
Maplewood NeighborhoodEstimated Value: $410,942 - $470,000
4
Beds
2
Baths
1,617
Sq Ft
$279/Sq Ft
Est. Value
About This Home
This home is located at 609 Laurel St, Fall River, MA 02721 and is currently estimated at $451,486, approximately $279 per square foot. 609 Laurel St is a home located in Bristol County with nearby schools including Henry Lord Community School, B M C Durfee High School, and Argosy Collegiate Charter School.
Ownership History
Date
Name
Owned For
Owner Type
Purchase Details
Closed on
Jan 26, 2012
Sold by
Beauchemin Marilyn A
Bought by
Beauchemin John A
Current Estimated Value
Purchase Details
Closed on
Sep 29, 1989
Sold by
Alova Rene T
Bought by
Beauchemin Edmund J
Home Financials for this Owner
Home Financials are based on the most recent Mortgage that was taken out on this home.
Original Mortgage
$79,000
Interest Rate
9.92%
Mortgage Type
Purchase Money Mortgage
Purchase Details
Closed on
Jul 10, 1987
Sold by
Souza Joseph
Bought by
Alova Rene T
Home Financials for this Owner
Home Financials are based on the most recent Mortgage that was taken out on this home.
Original Mortgage
$99,900
Interest Rate
10.71%
Mortgage Type
Purchase Money Mortgage
Create a Home Valuation Report for This Property
The Home Valuation Report is an in-depth analysis detailing your home's value as well as a comparison with similar homes in the area
Home Values in the Area
Average Home Value in this Area
Purchase History
| Date | Buyer | Sale Price | Title Company |
|---|---|---|---|
| Beauchemin John A | -- | -- | |
| Alova Rene T | $99,900 | -- | |
| Beauchemin Edmund J | $119,000 | -- |
Source: Public Records
Mortgage History
| Date | Status | Borrower | Loan Amount |
|---|---|---|---|
| Previous Owner | Alova Rene T | $79,000 | |
| Previous Owner | Alova Rene T | $99,900 |
Source: Public Records
Tax History
| Year | Tax Paid | Tax Assessment Tax Assessment Total Assessment is a certain percentage of the fair market value that is determined by local assessors to be the total taxable value of land and additions on the property. | Land | Improvement |
|---|---|---|---|---|
| 2025 | $3,971 | $346,800 | $130,100 | $216,700 |
| 2024 | $3,749 | $326,300 | $125,200 | $201,100 |
| 2023 | $3,671 | $299,200 | $107,300 | $191,900 |
| 2022 | $3,270 | $259,100 | $97,600 | $161,500 |
| 2021 | $3,105 | $224,500 | $90,300 | $134,200 |
| 2020 | $2,922 | $202,200 | $86,400 | $115,800 |
| 2019 | $2,817 | $193,200 | $82,300 | $110,900 |
| 2018 | $2,699 | $184,600 | $80,800 | $103,800 |
| 2017 | $2,582 | $184,400 | $82,400 | $102,000 |
| 2016 | $2,493 | $182,900 | $85,800 | $97,100 |
| 2015 | $2,350 | $179,700 | $82,600 | $97,100 |
| 2014 | $2,316 | $184,100 | $87,000 | $97,100 |
Source: Public Records
Map
Nearby Homes
Your Personal Tour Guide
Ask me questions while you tour the home.