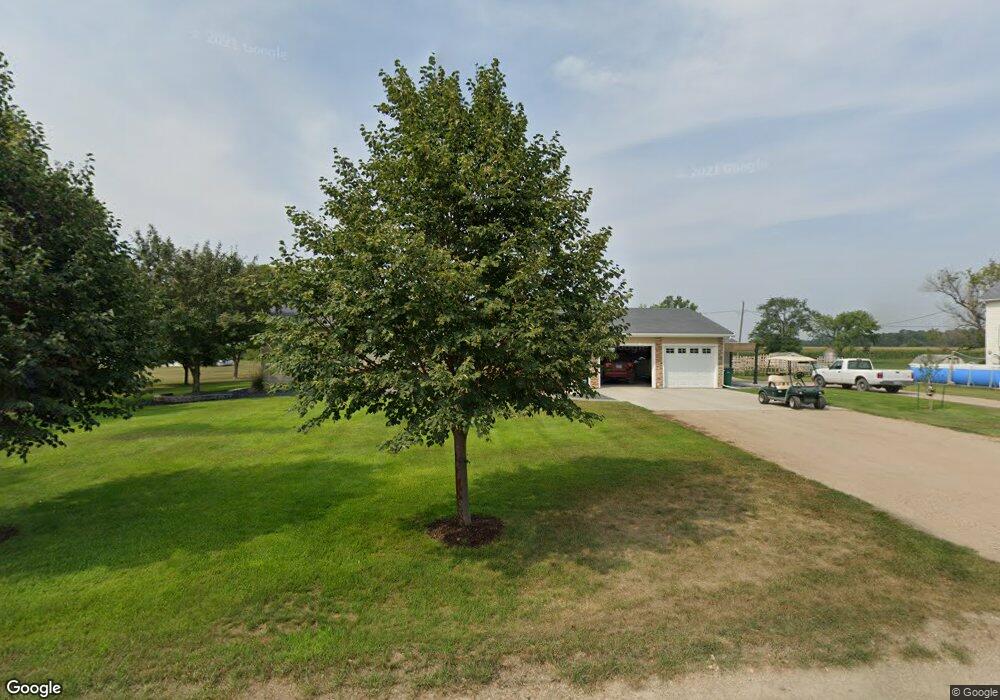
609 Main St Abercrombie, ND 58001
Estimated Value: $372,000 - $406,908
3
Beds
3
Baths
2,864
Sq Ft
$136/Sq Ft
Est. Value
About This Home
This home is located at 609 Main St, Abercrombie, ND 58001 and is currently estimated at $388,477, approximately $135 per square foot. 609 Main St is a home located in Richland County with nearby schools including Richland Elementary School and Richland Junior/Senior High School.
Ownership History
Date
Name
Owned For
Owner Type
Purchase Details
Closed on
Apr 7, 2021
Sold by
Kinneberg Mitchell Jay and Kinneberg Renee Lon
Bought by
Bolme Ryan S and Olson Morgan C
Current Estimated Value
Home Financials for this Owner
Home Financials are based on the most recent Mortgage that was taken out on this home.
Original Mortgage
$220,500
Outstanding Balance
$195,679
Interest Rate
2.9%
Mortgage Type
New Conventional
Estimated Equity
$192,798
Create a Home Valuation Report for This Property
The Home Valuation Report is an in-depth analysis detailing your home's value as well as a comparison with similar homes in the area
Purchase History
| Date | Buyer | Sale Price | Title Company |
|---|---|---|---|
| Bolme Ryan S | $320,500 | Title Company Residential |
Source: Public Records
Mortgage History
| Date | Status | Borrower | Loan Amount |
|---|---|---|---|
| Open | Bolme Ryan S | $220,500 |
Source: Public Records
Tax History
| Year | Tax Paid | Tax Assessment Tax Assessment Total Assessment is a certain percentage of the fair market value that is determined by local assessors to be the total taxable value of land and additions on the property. | Land | Improvement |
|---|---|---|---|---|
| 2024 | $3,730 | $170,950 | $7,800 | $163,150 |
| 2023 | $3,609 | $167,800 | $7,800 | $160,000 |
| 2022 | $3,584 | $163,300 | $7,800 | $155,500 |
| 2021 | $3,550 | $155,550 | $7,800 | $147,750 |
| 2020 | $2,567 | $108,850 | $7,100 | $101,750 |
| 2019 | $2,648 | $108,850 | $7,100 | $101,750 |
| 2018 | $2,674 | $106,400 | $4,650 | $101,750 |
| 2017 | $2,383 | $86,100 | $4,400 | $81,700 |
| 2016 | $1,623 | $66,300 | $4,400 | $61,900 |
| 2015 | -- | $5,967 | $0 | $0 |
| 2014 | -- | $5,967 | $0 | $0 |
| 2013 | -- | $5,967 | $0 | $0 |
Source: Public Records
Map
Nearby Homes
- 311 4th Ave E
- 402 Sheyenne Dr
- 101 Harris St
- 1265 170th St
- 608 Blaine St S
- 709 Blaine St N
- 707 Blaine St N
- 603 Blaine St N
- 604 Lorraine Way
- 602 Lorraine Way
- 606 Lorraine Way
- 600 Lorraine Way
- 601 Lorraine Way
- 603 Lorraine Way
- 700 Lorraine Way
- 702 Lorraine Way
- 701 Lorraine Way
- 704 Lorraine Way
- 605 Lorraine Way
- 703 Lorraine Way
Your Personal Tour Guide
Ask me questions while you tour the home.