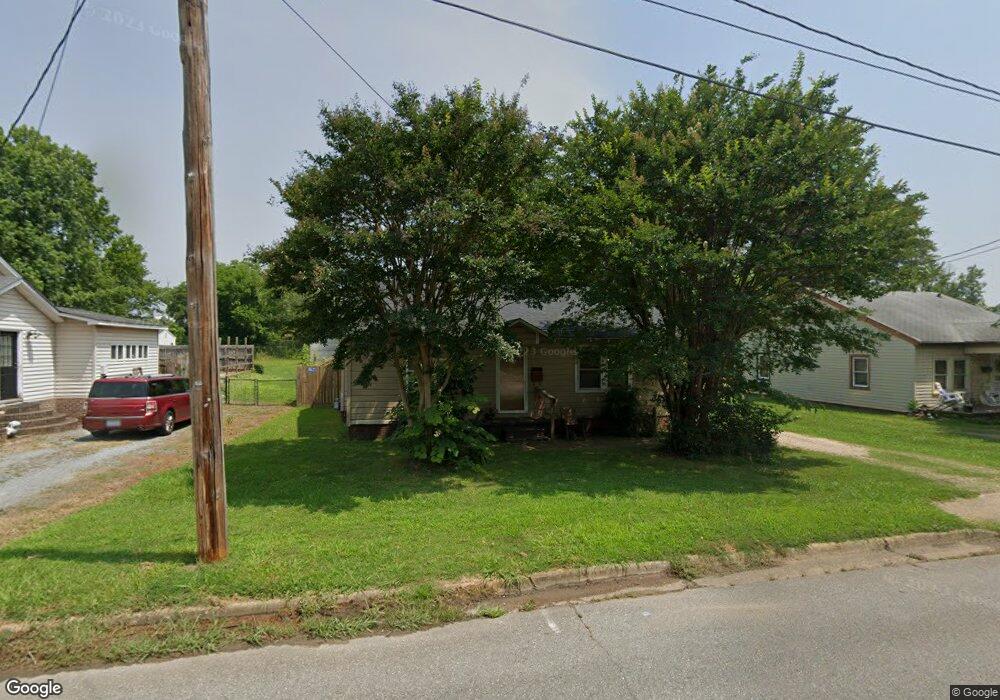
609 Mauney Ave Kings Mountain, NC 28086
Estimated Value: $178,000 - $608,551
--
Bed
--
Bath
940
Sq Ft
$468/Sq Ft
Est. Value
About This Home
This home is located at 609 Mauney Ave, Kings Mountain, NC 28086 and is currently estimated at $440,388, approximately $468 per square foot. 609 Mauney Ave is a home located in Cleveland County with nearby schools including East Elementary School, Kings Mountain Middle, and Kings Mountain Intermediate School.
Ownership History
Date
Name
Owned For
Owner Type
Purchase Details
Closed on
Sep 29, 2023
Sold by
Johnson Donald W and Johnson Zena H
Bought by
Km Commercial Rentals Llc
Current Estimated Value
Home Financials for this Owner
Home Financials are based on the most recent Mortgage that was taken out on this home.
Original Mortgage
$353,920
Outstanding Balance
$345,355
Interest Rate
6%
Mortgage Type
New Conventional
Estimated Equity
$95,033
Purchase Details
Closed on
Apr 10, 1990
Sold by
Johnson Donald Willard and Johnson Regina Dale
Bought by
Johnson Donald Willard
Create a Home Valuation Report for This Property
The Home Valuation Report is an in-depth analysis detailing your home's value as well as a comparison with similar homes in the area
Home Values in the Area
Average Home Value in this Area
Purchase History
| Date | Buyer | Sale Price | Title Company |
|---|---|---|---|
| Km Commercial Rentals Llc | $568,400 | None Listed On Document | |
| Km Commercial Rentals Llc | $568,400 | None Listed On Document | |
| Km Commercial Rentals Llc | $568,400 | None Listed On Document | |
| Km Commercial Rentals Llc | $568,400 | None Listed On Document | |
| Km Commercial Rentals Llc | $568,400 | None Listed On Document | |
| Johnson Donald Willard | -- | None Available |
Source: Public Records
Mortgage History
| Date | Status | Borrower | Loan Amount |
|---|---|---|---|
| Open | Km Commercial Rentals Llc | $353,920 | |
| Closed | Km Commercial Rentals Llc | $353,920 |
Source: Public Records
Tax History Compared to Growth
Tax History
| Year | Tax Paid | Tax Assessment Tax Assessment Total Assessment is a certain percentage of the fair market value that is determined by local assessors to be the total taxable value of land and additions on the property. | Land | Improvement |
|---|---|---|---|---|
| 2025 | $550 | $53,631 | $16,200 | $37,431 |
| 2024 | $601 | $49,371 | $14,985 | $34,386 |
| 2023 | $598 | $49,371 | $14,985 | $34,386 |
| 2022 | $574 | $49,371 | $14,985 | $34,386 |
| 2021 | $577 | $49,371 | $14,985 | $34,386 |
| 2020 | $481 | $39,900 | $11,664 | $28,236 |
| 2019 | $481 | $39,900 | $11,664 | $28,236 |
| 2018 | $480 | $39,900 | $11,664 | $28,236 |
| 2017 | $477 | $39,900 | $11,664 | $28,236 |
| 2016 | $477 | $39,900 | $11,664 | $28,236 |
| 2015 | $475 | $40,771 | $10,125 | $30,646 |
| 2014 | $475 | $40,771 | $10,125 | $30,646 |
Source: Public Records
Map
Nearby Homes
- 309 York Rd
- 114 Hendricks St
- 506 E Ridge St
- 110 N Oriental Ave
- 0 Canterbury Rd
- 311 E King St Unit 2
- 710 York Rd
- 110 N Gaston St
- 200 E Gold St
- 308 N Carpenter St
- 25 Bennett Dr
- 403 Cherry St
- 409 Chestnut St
- 408 Walnut St
- 5066 Beargrass Dr
- 405 Clinton Dr
- 411 S Battleground Ave
- 316 S Cansler St
- 527 Katherine Ave
- 207 Morris St