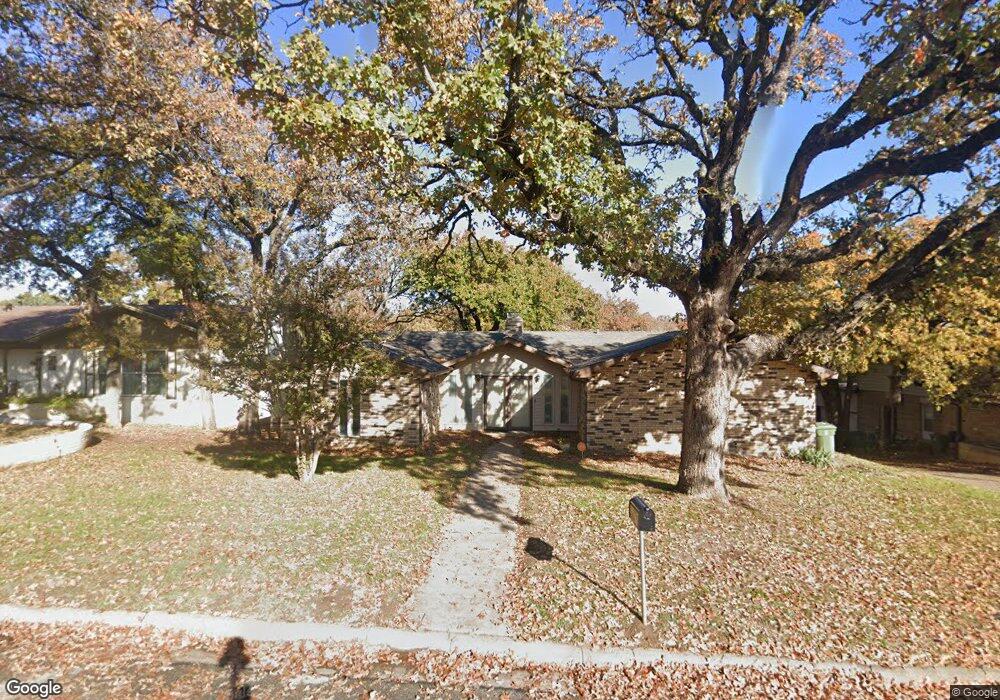
609 Monette Dr Bedford, TX 76022
Estimated Value: $364,375 - $420,000
4
Beds
3
Baths
2,160
Sq Ft
$182/Sq Ft
Est. Value
About This Home
This home is located at 609 Monette Dr, Bedford, TX 76022 and is currently estimated at $393,094, approximately $181 per square foot. 609 Monette Dr is a home located in Tarrant County with nearby schools including Stonegate Elementary School, Central J High School, and L.D. Bell High School.
Ownership History
Date
Name
Owned For
Owner Type
Purchase Details
Closed on
Oct 15, 2020
Sold by
Miller Marvin and Salinas Lesley
Bought by
Goings Cheyanne
Current Estimated Value
Home Financials for this Owner
Home Financials are based on the most recent Mortgage that was taken out on this home.
Original Mortgage
$237,500
Outstanding Balance
$210,766
Interest Rate
2.9%
Mortgage Type
New Conventional
Estimated Equity
$182,328
Purchase Details
Closed on
Mar 20, 2017
Sold by
Sschramm Florida M
Bought by
Mioller Marvin and Salinas Leslcy
Home Financials for this Owner
Home Financials are based on the most recent Mortgage that was taken out on this home.
Original Mortgage
$216,930
Interest Rate
4.19%
Purchase Details
Closed on
Sep 6, 2001
Sold by
Schramm Florian M
Bought by
Schramm Florian M and The Schramm Family Trust
Create a Home Valuation Report for This Property
The Home Valuation Report is an in-depth analysis detailing your home's value as well as a comparison with similar homes in the area
Home Values in the Area
Average Home Value in this Area
Purchase History
| Date | Buyer | Sale Price | Title Company |
|---|---|---|---|
| Goings Cheyanne | -- | None Listed On Document | |
| Mioller Marvin | -- | Capital Title | |
| Schramm Florian M | -- | -- |
Source: Public Records
Mortgage History
| Date | Status | Borrower | Loan Amount |
|---|---|---|---|
| Open | Goings Cheyanne | $237,500 | |
| Previous Owner | Mioller Marvin | $216,930 |
Source: Public Records
Tax History Compared to Growth
Tax History
| Year | Tax Paid | Tax Assessment Tax Assessment Total Assessment is a certain percentage of the fair market value that is determined by local assessors to be the total taxable value of land and additions on the property. | Land | Improvement |
|---|---|---|---|---|
| 2025 | $5,121 | $272,754 | $75,000 | $197,754 |
| 2024 | $5,121 | $328,051 | $75,000 | $253,051 |
| 2023 | $5,754 | $300,000 | $55,000 | $245,000 |
| 2022 | $6,006 | $275,000 | $55,000 | $220,000 |
| 2021 | $6,093 | $258,643 | $55,000 | $203,643 |
| 2020 | $5,816 | $244,596 | $55,000 | $189,596 |
| 2019 | $5,612 | $259,233 | $55,000 | $204,233 |
| 2018 | $4,720 | $210,000 | $30,000 | $180,000 |
| 2017 | $4,836 | $214,247 | $30,000 | $184,247 |
| 2016 | $4,397 | $181,739 | $30,000 | $151,739 |
| 2015 | $2,603 | $173,200 | $20,000 | $153,200 |
| 2014 | $2,603 | $173,200 | $20,000 | $153,200 |
Source: Public Records
Map
Nearby Homes
- 933 Wade Dr
- 1108 Wade Dr
- 832 Chateau Valee Cir
- 909 Overhill Dr
- 921 Overhill Dr
- 501 Merrill Dr
- 849 Russell Ln
- 1008 Russell Ln
- 1004 Overhill Dr
- 604 Donna Ln
- 1204 Edgecliff Dr
- 1200 Tanglewood Trail
- 341 Hurst Dr
- 1031 Boston Blvd
- 344 Bedford Ct E
- 904 Nelson Terrace
- 1236 King Dr
- 1213 Briar Dr
- 1112 Ann St
- 803 Glenda Dr