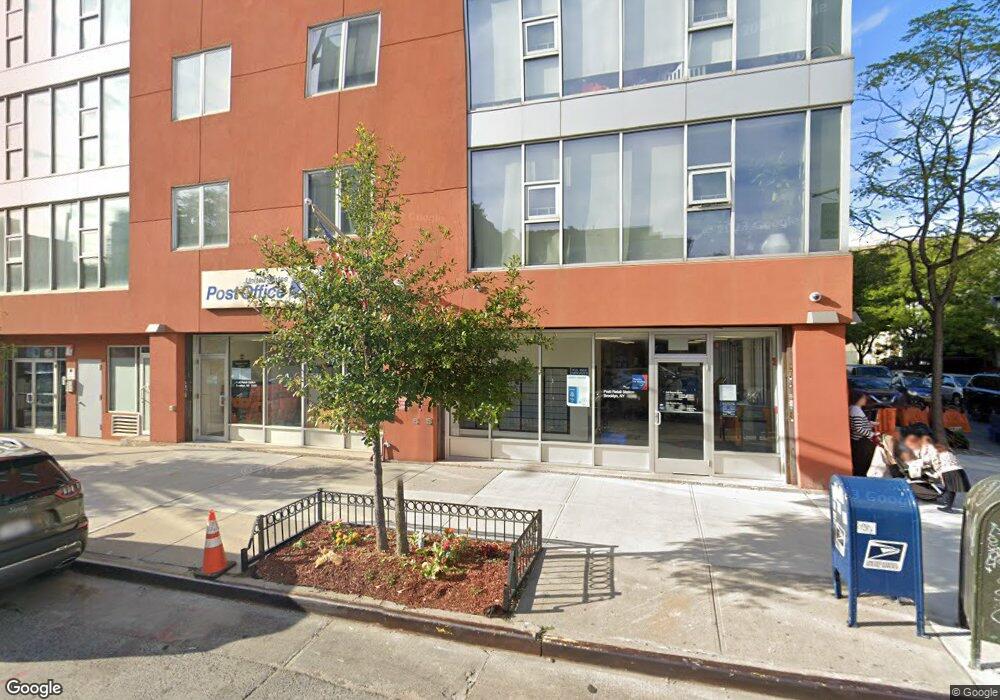
609 Myrtle Ave Unit 5A613 Brooklyn, NY 11205
Bed-Stuy NeighborhoodEstimated Value: $883,000 - $1,242,000
--
Bed
--
Bath
1,008
Sq Ft
$1,044/Sq Ft
Est. Value
About This Home
This home is located at 609 Myrtle Ave Unit 5A613, Brooklyn, NY 11205 and is currently estimated at $1,051,868, approximately $1,043 per square foot. 609 Myrtle Ave Unit 5A613 is a home located in Kings County with nearby schools including P.S. 157 Benjamin Franklin, Community Partnership Charter School - Elementary School, and Mosdos Krula.
Ownership History
Date
Name
Owned For
Owner Type
Purchase Details
Closed on
Mar 2, 2015
Sold by
Chinyelu Kim and Chinyelu Mukama
Bought by
Gelfman Lauren and Rubenstein Greg
Current Estimated Value
Home Financials for this Owner
Home Financials are based on the most recent Mortgage that was taken out on this home.
Original Mortgage
$652,000
Outstanding Balance
$497,887
Interest Rate
3.6%
Mortgage Type
Purchase Money Mortgage
Estimated Equity
$553,981
Purchase Details
Closed on
Dec 30, 2008
Sold by
Nam Realty Associates Llc
Bought by
Chinyelu Kim and Chinyelu Mukama
Home Financials for this Owner
Home Financials are based on the most recent Mortgage that was taken out on this home.
Original Mortgage
$365,000
Interest Rate
5.52%
Mortgage Type
Purchase Money Mortgage
Create a Home Valuation Report for This Property
The Home Valuation Report is an in-depth analysis detailing your home's value as well as a comparison with similar homes in the area
Home Values in the Area
Average Home Value in this Area
Purchase History
| Date | Buyer | Sale Price | Title Company |
|---|---|---|---|
| Gelfman Lauren | $833,000 | -- | |
| Chinyelu Kim | $535,000 | -- | |
| Chinyelu Kim | $535,000 | -- |
Source: Public Records
Mortgage History
| Date | Status | Borrower | Loan Amount |
|---|---|---|---|
| Open | Gelfman Lauren | $652,000 | |
| Previous Owner | Chinyelu Kim | $365,000 |
Source: Public Records
Tax History Compared to Growth
Tax History
| Year | Tax Paid | Tax Assessment Tax Assessment Total Assessment is a certain percentage of the fair market value that is determined by local assessors to be the total taxable value of land and additions on the property. | Land | Improvement |
|---|---|---|---|---|
| 2025 | $831 | $114,711 | $4,396 | $110,315 |
| 2024 | $831 | $99,992 | $4,396 | $95,596 |
| 2023 | $815 | $105,293 | $4,396 | $100,897 |
| 2022 | $813 | $99,895 | $4,396 | $95,499 |
| 2021 | $815 | $93,153 | $4,396 | $88,757 |
| 2020 | $401 | $102,931 | $4,396 | $98,535 |
| 2019 | $838 | $100,275 | $4,396 | $95,879 |
| 2016 | $857 | $81,650 | $4,396 | $77,254 |
| 2015 | $669 | $71,692 | $4,396 | $67,296 |
| 2014 | $669 | $69,555 | $4,396 | $65,159 |
Source: Public Records
Map
Nearby Homes
- 218 Classon Ave Unit GARDEN
- 970 Kent Ave Unit 513
- 111 Steuben St Unit 2D
- 689 Myrtle Ave Unit 2E
- 244 Franklin Ave Unit 5B
- 192 Spencer St Unit 3A
- 192 Spencer St Unit 1E
- 192 Spencer St Unit 1-D
- 192 Spencer St Unit 4-E
- 433 Dekalb Ave
- 102 Walworth St
- 195 Spencer St Unit 7B
- 197 Spencer St Unit 3B
- 195 Willoughby Ave Unit 210
- 195 Willoughby Ave Unit 905
- 195 Willoughby Ave Unit 1708
- 195 Willoughby Ave Unit 602
- 501 Myrtle Ave Unit 4 B
- 764 Kent Ave Unit 2
- 116 Ryerson St
- 609 Myrtle Ave Unit 6B613
- 609 Myrtle Ave Unit 6A613
- 609 Myrtle Ave Unit 5D613
- 609 Myrtle Ave Unit 5C613
- 609 Myrtle Ave Unit 5B613
- 609 Myrtle Ave Unit 4D613
- 609 Myrtle Ave Unit 4C613
- 609 Myrtle Ave Unit 4B613
- 609 Myrtle Ave Unit 4A613
- 609 Myrtle Ave Unit 3D613
- 609 Myrtle Ave Unit 3C613
- 609 Myrtle Ave Unit 3B613
- 609 Myrtle Ave Unit 3A613
- 609 Myrtle Ave Unit 2D613
- 609 Myrtle Ave Unit 2C613
- 609 Myrtle Ave Unit 2B613
- 609 Myrtle Ave Unit 2A613
- 609 Myrtle Ave Unit COMM C1 & CF1
- 609 Myrtle Ave Unit CF 1
- 609 Myrtle Ave Unit C-1