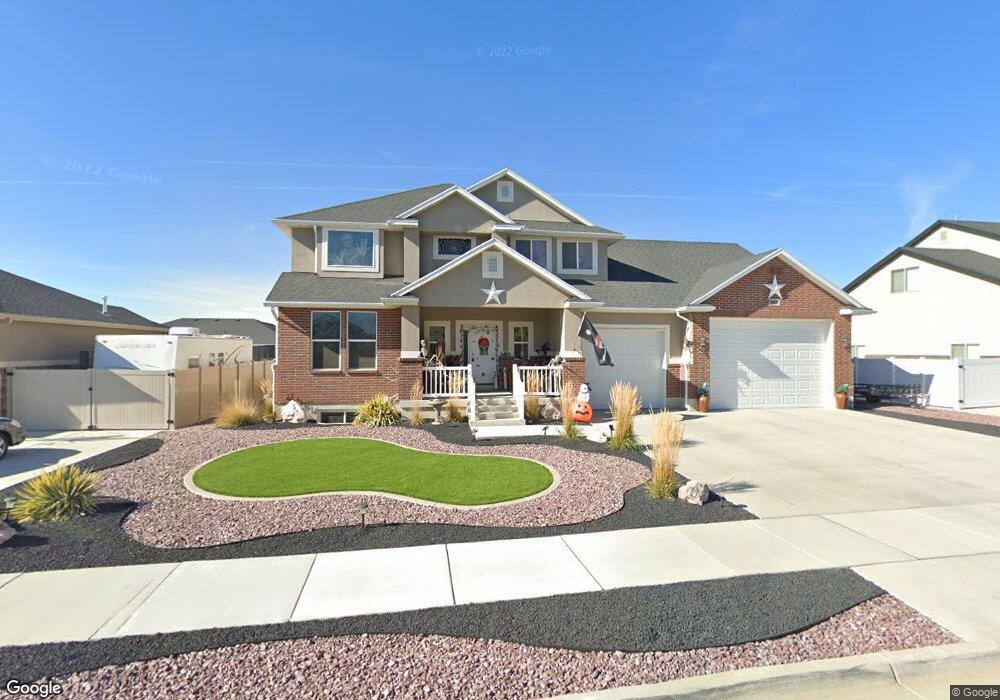
609 N 3025 W West Point, UT 84015
Estimated Value: $685,000 - $762,000
4
Beds
3
Baths
3,939
Sq Ft
$186/Sq Ft
Est. Value
About This Home
This home is located at 609 N 3025 W, West Point, UT 84015 and is currently estimated at $731,445, approximately $185 per square foot. 609 N 3025 W is a home located in Davis County with nearby schools including Lakeside School, West Point Junior High School, and Syracuse High School.
Ownership History
Date
Name
Owned For
Owner Type
Purchase Details
Closed on
Mar 28, 2018
Sold by
Moser Brain and Moser Bernice
Bought by
Moser Bernice L and Moser Family Trust
Current Estimated Value
Home Financials for this Owner
Home Financials are based on the most recent Mortgage that was taken out on this home.
Original Mortgage
$283,600
Outstanding Balance
$243,022
Interest Rate
4.38%
Mortgage Type
Commercial
Estimated Equity
$488,423
Purchase Details
Closed on
Jan 28, 2016
Sold by
Castle Creek Homes Llc
Bought by
Moser Brian and Moser Bernice
Create a Home Valuation Report for This Property
The Home Valuation Report is an in-depth analysis detailing your home's value as well as a comparison with similar homes in the area
Home Values in the Area
Average Home Value in this Area
Purchase History
| Date | Buyer | Sale Price | Title Company |
|---|---|---|---|
| Moser Bernice L | -- | -- | |
| Moser Brian | -- | Mountain View Title |
Source: Public Records
Mortgage History
| Date | Status | Borrower | Loan Amount |
|---|---|---|---|
| Open | Moser Bernice L | $283,600 |
Source: Public Records
Tax History Compared to Growth
Tax History
| Year | Tax Paid | Tax Assessment Tax Assessment Total Assessment is a certain percentage of the fair market value that is determined by local assessors to be the total taxable value of land and additions on the property. | Land | Improvement |
|---|---|---|---|---|
| 2025 | $4,220 | $395,450 | $102,681 | $292,769 |
| 2024 | $4,137 | $389,400 | $92,493 | $296,907 |
| 2023 | $3,956 | $685,000 | $112,305 | $572,695 |
| 2022 | $4,219 | $399,850 | $57,601 | $342,249 |
| 2021 | $3,681 | $522,000 | $93,196 | $428,804 |
| 2020 | $3,231 | $452,000 | $77,702 | $374,298 |
| 2019 | $3,030 | $418,000 | $75,561 | $342,439 |
| 2018 | $2,772 | $377,000 | $76,871 | $300,129 |
| 2016 | $2,609 | $186,670 | $29,685 | $156,985 |
| 2015 | $796 | $53,973 | $53,973 | $0 |
| 2014 | $785 | $53,973 | $53,973 | $0 |
Source: Public Records
Map
Nearby Homes
- 488 N 3100 W
- 3187 W 525 N
- 3212 W 600 N
- 399 N 3425 W
- 2816 W 960 N
- 2535 W 550 N
- 878 N 2600 W
- 1172 N 3000 W
- 2633 N 2080 W Unit 180
- 2623 N 2080 W Unit 178
- 380 S 4300 W Unit 608
- 997 N 5100 W Unit 213
- 2619 N 2080 W Unit 177
- 2627 N 2080 W Unit 179
- 3232 W 375 N Unit 7
- 3258 W 375 N Unit 9
- 260 W Antelope Dr S
- 4200 W 800 N
- 2792 W 50 S
- 2959 W 1300 N