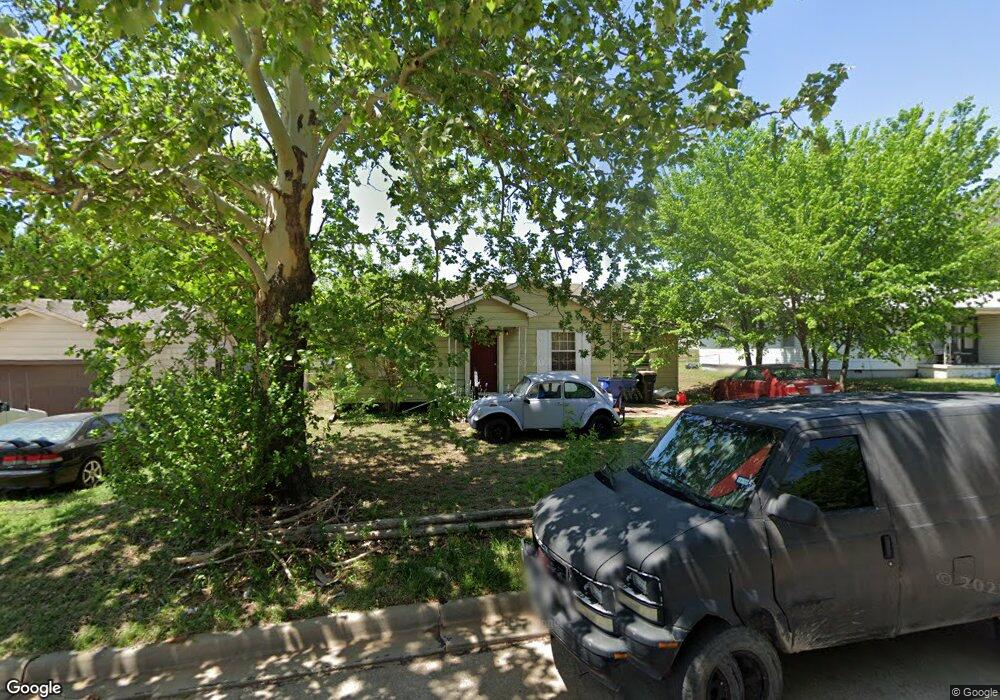
609 N G St Duncan, OK 73533
Estimated Value: $50,157 - $55,000
2
Beds
1
Bath
942
Sq Ft
$55/Sq Ft
Est. Value
About This Home
This home is located at 609 N G St, Duncan, OK 73533 and is currently estimated at $52,039, approximately $55 per square foot. 609 N G St is a home located in Stephens County with nearby schools including Woodrow Wilson Elementary School, Duncan Middle School, and Duncan High School.
Ownership History
Date
Name
Owned For
Owner Type
Purchase Details
Closed on
Oct 23, 2023
Sold by
Murphree Kreg
Bought by
Griffin Robert
Current Estimated Value
Purchase Details
Closed on
Oct 6, 2010
Sold by
Qualls Sherry and Qualls Sherry K
Bought by
Random Acres Llc
Home Financials for this Owner
Home Financials are based on the most recent Mortgage that was taken out on this home.
Original Mortgage
$26,000
Interest Rate
4.42%
Mortgage Type
Purchase Money Mortgage
Purchase Details
Closed on
Oct 25, 2005
Sold by
Nelson Earl and Nelson Mary Lou
Bought by
Qualls Sherry
Home Financials for this Owner
Home Financials are based on the most recent Mortgage that was taken out on this home.
Original Mortgage
$26,346
Interest Rate
5.9%
Mortgage Type
Unknown
Purchase Details
Closed on
Sep 25, 2001
Sold by
Fields Larry and Fields Janet
Purchase Details
Closed on
Jun 15, 1990
Create a Home Valuation Report for This Property
The Home Valuation Report is an in-depth analysis detailing your home's value as well as a comparison with similar homes in the area
Home Values in the Area
Average Home Value in this Area
Purchase History
| Date | Buyer | Sale Price | Title Company |
|---|---|---|---|
| Griffin Robert | -- | None Listed On Document | |
| Random Acres Llc | $26,000 | None Available | |
| Qualls Sherry | $30,000 | None Available | |
| -- | $15,000 | -- | |
| -- | $3,500 | -- |
Source: Public Records
Mortgage History
| Date | Status | Borrower | Loan Amount |
|---|---|---|---|
| Previous Owner | Random Acres Llc | $26,000 | |
| Previous Owner | Qualls Sherry | $26,346 |
Source: Public Records
Tax History Compared to Growth
Tax History
| Year | Tax Paid | Tax Assessment Tax Assessment Total Assessment is a certain percentage of the fair market value that is determined by local assessors to be the total taxable value of land and additions on the property. | Land | Improvement |
|---|---|---|---|---|
| 2025 | $337 | $3,994 | $482 | $3,512 |
| 2024 | $340 | $3,989 | $482 | $3,507 |
| 2023 | $340 | $3,799 | $482 | $3,317 |
| 2022 | $236 | $3,048 | $482 | $2,566 |
| 2021 | $236 | $2,772 | $482 | $2,290 |
| 2020 | $217 | $2,514 | $482 | $2,032 |
| 2019 | $214 | $2,470 | $482 | $1,988 |
| 2018 | $221 | $2,484 | $482 | $2,002 |
| 2017 | $246 | $2,864 | $482 | $2,382 |
| 2016 | $254 | $2,986 | $482 | $2,504 |
| 2015 | $305 | $2,986 | $482 | $2,504 |
| 2014 | $305 | $2,986 | $482 | $2,504 |
Source: Public Records
Map
Nearby Homes