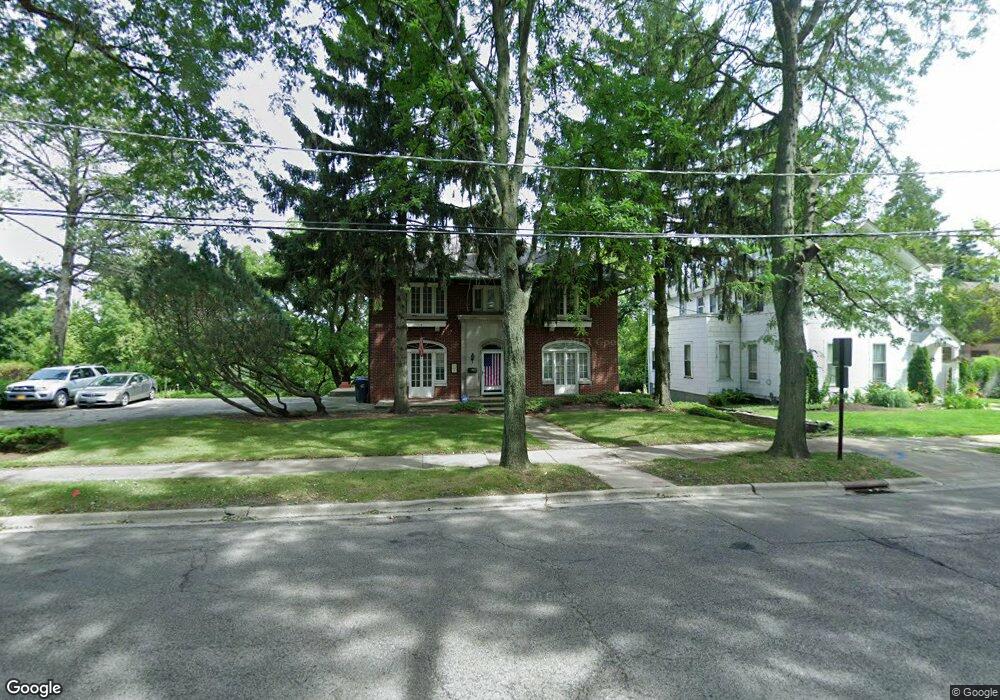
609 N Sheridan Rd Waukegan, IL 60085
Estimated Value: $352,772 - $408,000
3
Beds
4
Baths
2,888
Sq Ft
$130/Sq Ft
Est. Value
About This Home
This home is located at 609 N Sheridan Rd, Waukegan, IL 60085 and is currently estimated at $376,193, approximately $130 per square foot. 609 N Sheridan Rd is a home located in Lake County with nearby schools including Edith M Smith Middle School, Waukegan High School, and LEARN John & Kathy Schreiber Campus.
Ownership History
Date
Name
Owned For
Owner Type
Purchase Details
Closed on
Jul 7, 2005
Sold by
Atherton Charles D
Bought by
Atherton Charles D and Atherton Revocable T Charles D
Current Estimated Value
Purchase Details
Closed on
Jan 14, 2004
Sold by
Chandler Joni A
Bought by
Atherton Charles D
Home Financials for this Owner
Home Financials are based on the most recent Mortgage that was taken out on this home.
Original Mortgage
$280,000
Outstanding Balance
$131,036
Interest Rate
5.91%
Mortgage Type
Purchase Money Mortgage
Estimated Equity
$245,157
Purchase Details
Closed on
Nov 20, 1998
Sold by
Austin Bank Of Chicago
Bought by
Chandler Joni A J
Home Financials for this Owner
Home Financials are based on the most recent Mortgage that was taken out on this home.
Original Mortgage
$207,000
Interest Rate
12.74%
Create a Home Valuation Report for This Property
The Home Valuation Report is an in-depth analysis detailing your home's value as well as a comparison with similar homes in the area
Home Values in the Area
Average Home Value in this Area
Purchase History
| Date | Buyer | Sale Price | Title Company |
|---|---|---|---|
| Atherton Charles D | -- | None Available | |
| Atherton Charles D | $375,000 | Metropolitan Title Co | |
| Chandler Joni A J | -- | Stewart Title |
Source: Public Records
Mortgage History
| Date | Status | Borrower | Loan Amount |
|---|---|---|---|
| Open | Atherton Charles D | $280,000 | |
| Previous Owner | Chandler Joni A J | $207,000 |
Source: Public Records
Tax History Compared to Growth
Tax History
| Year | Tax Paid | Tax Assessment Tax Assessment Total Assessment is a certain percentage of the fair market value that is determined by local assessors to be the total taxable value of land and additions on the property. | Land | Improvement |
|---|---|---|---|---|
| 2024 | $9,519 | $111,727 | $21,774 | $89,953 |
| 2023 | $10,848 | $100,948 | $19,673 | $81,275 |
| 2022 | $10,848 | $110,969 | $34,026 | $76,943 |
| 2021 | $10,743 | $103,048 | $30,275 | $72,773 |
| 2020 | $10,882 | $96,002 | $28,205 | $67,797 |
| 2019 | $10,952 | $87,970 | $25,845 | $62,125 |
| 2018 | $11,195 | $86,586 | $31,355 | $55,231 |
| 2017 | $10,897 | $76,604 | $27,740 | $48,864 |
| 2016 | $10,287 | $66,566 | $24,105 | $42,461 |
| 2015 | $10,064 | $59,577 | $21,574 | $38,003 |
| 2014 | $8,864 | $52,390 | $14,831 | $37,559 |
| 2012 | $10,214 | $56,760 | $16,068 | $40,692 |
Source: Public Records
Map
Nearby Homes
- 611 N Genesee St
- 723 N County St
- 325 4th St
- 222 Grand Ave
- 452 North Ave
- 415 W Ridgeland Ave
- 702 Franklin St
- 620 N Poplar St
- 522 N Poplar St
- 428 N Poplar St
- 918 N Ash St
- 511 Chestnut St
- 1110 N Ash St
- 1122 N Ash St
- 28 N Saint James St
- 917 N Linden Ave
- 613 Washington St
- 1109 Massena Ave
- 1336 N Ash St
- 1335 Chestnut St
- 605 N Sheridan Rd
- 601 N Sheridan Rd
- 619 N Sheridan Rd
- 535 N Sheridan Rd
- 610 N Sheridan Rd
- 610 N Sheridan Rd Unit 1
- 616 N Sheridan Rd
- 606 N Sheridan Rd
- 624 N Sheridan Rd
- 527 N Sheridan Rd
- 629 N Sheridan Rd
- 532 N Sheridan Rd
- 628 N Sheridan Rd
- 613 N Genesee St
- 607 N Genesee St
- 603 N Genesee St
- 635 N Sheridan Rd
- 523 N Sheridan Rd
- 634 N Sheridan Rd
- 526 N Sheridan Rd