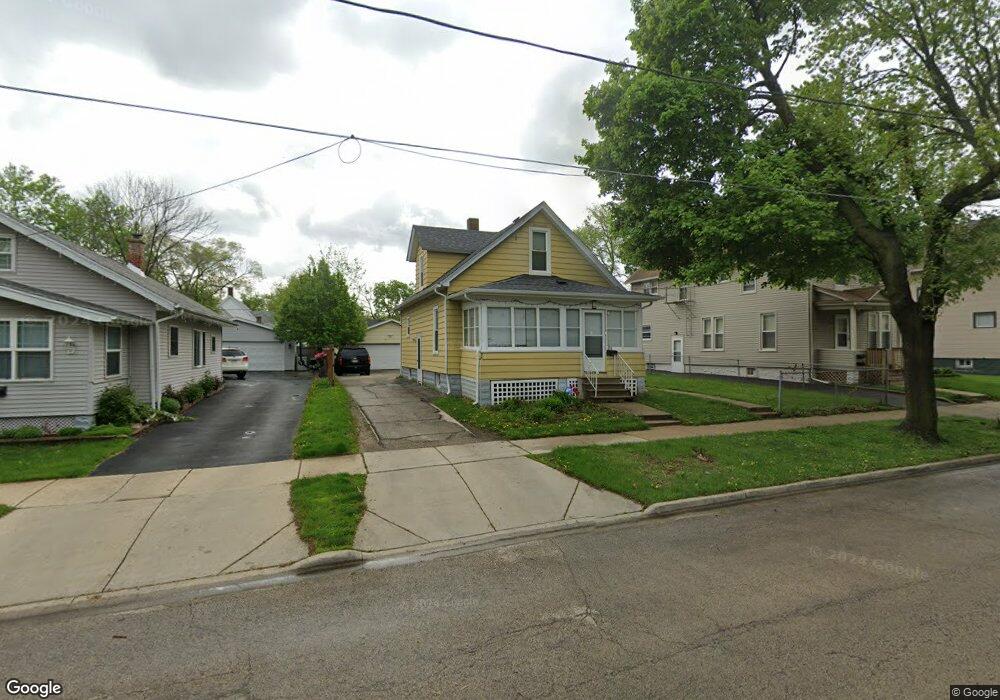
609 N View St Aurora, IL 60506
Near West Galena NeighborhoodEstimated Value: $200,000 - $228,134
3
Beds
1
Bath
924
Sq Ft
$235/Sq Ft
Est. Value
About This Home
This home is located at 609 N View St, Aurora, IL 60506 and is currently estimated at $217,034, approximately $234 per square foot. 609 N View St is a home located in Kane County with nearby schools including Hill Elementary School, Herget Middle School, and West Aurora High School.
Ownership History
Date
Name
Owned For
Owner Type
Purchase Details
Closed on
Sep 24, 2024
Sold by
Classic Investments Llc
Bought by
Blanco Tanislao and Blanco Consuelo
Current Estimated Value
Home Financials for this Owner
Home Financials are based on the most recent Mortgage that was taken out on this home.
Original Mortgage
$173,794
Outstanding Balance
$172,062
Interest Rate
6.63%
Mortgage Type
FHA
Estimated Equity
$44,972
Purchase Details
Closed on
Oct 12, 2021
Sold by
Seabrooks Dezi O and Seabrooks Donna E
Bought by
Kendall Partners Ltd
Purchase Details
Closed on
Feb 3, 2005
Sold by
Hayden Alice F
Bought by
Seabrooks Dezi O and Seabrooks Donna E
Home Financials for this Owner
Home Financials are based on the most recent Mortgage that was taken out on this home.
Original Mortgage
$56,000
Interest Rate
6.2%
Mortgage Type
Purchase Money Mortgage
Create a Home Valuation Report for This Property
The Home Valuation Report is an in-depth analysis detailing your home's value as well as a comparison with similar homes in the area
Home Values in the Area
Average Home Value in this Area
Purchase History
| Date | Buyer | Sale Price | Title Company |
|---|---|---|---|
| Blanco Tanislao | $177,000 | Fidelity National Title | |
| Kendall Partners Ltd | $132,500 | Chicago Title | |
| Seabrooks Dezi O | $70,000 | Chicago Title |
Source: Public Records
Mortgage History
| Date | Status | Borrower | Loan Amount |
|---|---|---|---|
| Open | Blanco Tanislao | $173,794 | |
| Previous Owner | Seabrooks Dezi O | $56,000 |
Source: Public Records
Tax History
| Year | Tax Paid | Tax Assessment Tax Assessment Total Assessment is a certain percentage of the fair market value that is determined by local assessors to be the total taxable value of land and additions on the property. | Land | Improvement |
|---|---|---|---|---|
| 2024 | $4,897 | $61,847 | $7,955 | $53,892 |
| 2023 | $4,733 | $55,260 | $7,108 | $48,152 |
| 2022 | $4,443 | $50,192 | $6,485 | $43,707 |
| 2021 | $4,269 | $46,730 | $6,038 | $40,692 |
| 2020 | $4,063 | $43,405 | $5,608 | $37,797 |
| 2019 | $3,932 | $40,216 | $5,196 | $35,020 |
| 2018 | $3,670 | $36,766 | $4,806 | $31,960 |
| 2017 | $3,549 | $34,488 | $4,428 | $30,060 |
| 2016 | $3,092 | $29,110 | $3,796 | $25,314 |
| 2015 | -- | $25,422 | $3,264 | $22,158 |
| 2014 | -- | $23,924 | $3,349 | $20,575 |
| 2013 | -- | $24,309 | $3,301 | $21,008 |
Source: Public Records
Map
Nearby Homes
- 603 N May St
- 519 N View St
- 418 W Illinois Ave
- 523 N Highland Ave
- 415 Blackhawk St
- 507 W Park Ave
- 355 Lawndale Ave
- 514 Spruce St
- 109 N May St
- 932 W New York St
- 424 N Lancaster Ave
- 231-233 Williams St
- 359 W Galena Blvd
- 450 W Downer Place Unit 4C
- 837 Taylor Ave
- 659 W Downer Place
- 14-18 N Lake St
- 479 N Lake St
- 469 N Lake St
- 256 W Downer Place
Your Personal Tour Guide
Ask me questions while you tour the home.