Estimated Value: $292,897 - $323,000
3
Beds
2
Baths
1,620
Sq Ft
$186/Sq Ft
Est. Value
About This Home
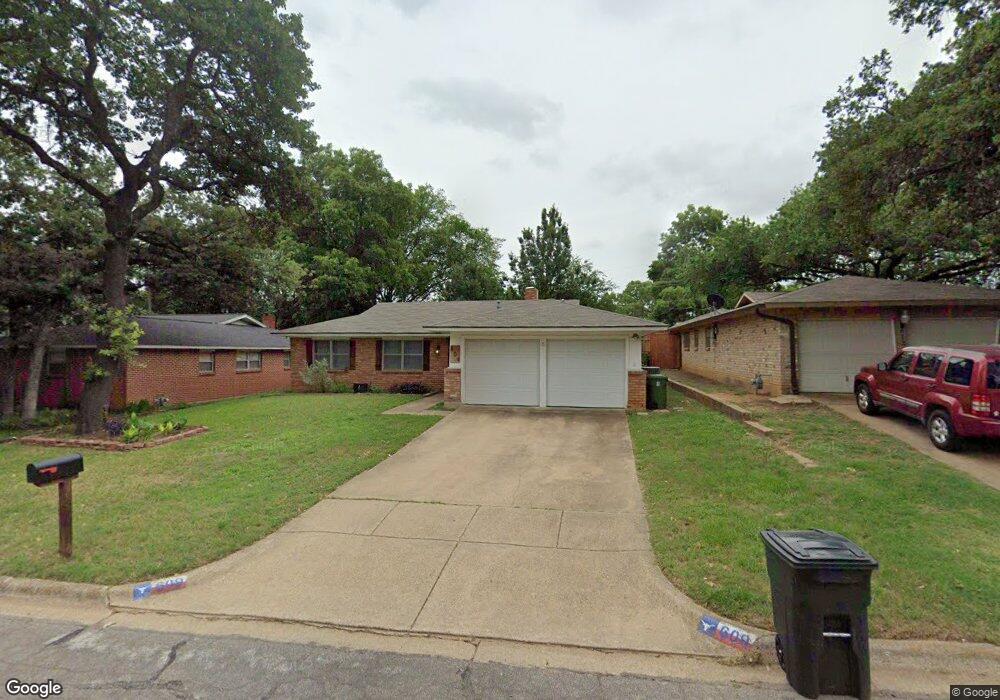
This home is located at 609 Oak Dr, Hurst, TX 76053 and is currently estimated at $300,974, approximately $185 per square foot. 609 Oak Dr is a home located in Tarrant County with nearby schools including West Hurst Elementary School, Hurst J High School, and L.D. Bell High School.
Ownership History
Date
Name
Owned For
Owner Type
Purchase Details
Closed on
Dec 30, 2019
Sold by
Gorman Tritvor D and Gorman Melissa G
Bought by
Smith Nathan A and Smith Katherine R
Current Estimated Value
Home Financials for this Owner
Home Financials are based on the most recent Mortgage that was taken out on this home.
Original Mortgage
$168,000
Outstanding Balance
$148,435
Interest Rate
3.6%
Mortgage Type
New Conventional
Estimated Equity
$152,539
Purchase Details
Closed on
Feb 16, 2018
Sold by
Opendoor Property W9 Llc
Bought by
Gorman Trevor D and Gorman Melissa G
Home Financials for this Owner
Home Financials are based on the most recent Mortgage that was taken out on this home.
Original Mortgage
$184,907
Interest Rate
3.95%
Mortgage Type
VA
Purchase Details
Closed on
Dec 15, 2017
Sold by
Morrison Jerry
Bought by
Opendoor Properties W9 Llc
Purchase Details
Closed on
May 21, 2009
Sold by
Powell Gregory S
Bought by
Morrison Jerry
Home Financials for this Owner
Home Financials are based on the most recent Mortgage that was taken out on this home.
Original Mortgage
$97,206
Interest Rate
4.76%
Mortgage Type
FHA
Create a Home Valuation Report for This Property
The Home Valuation Report is an in-depth analysis detailing your home's value as well as a comparison with similar homes in the area
Home Values in the Area
Average Home Value in this Area
Purchase History
| Date | Buyer | Sale Price | Title Company |
|---|---|---|---|
| Smith Nathan A | -- | None Available | |
| Gorman Trevor D | -- | Fidelity National Title | |
| Opendoor Properties W9 Llc | -- | Fidelity National Title | |
| Morrison Jerry | -- | None Available |
Source: Public Records
Mortgage History
| Date | Status | Borrower | Loan Amount |
|---|---|---|---|
| Open | Smith Nathan A | $168,000 | |
| Previous Owner | Gorman Trevor D | $184,907 | |
| Previous Owner | Morrison Jerry | $97,206 |
Source: Public Records
Tax History
| Year | Tax Paid | Tax Assessment Tax Assessment Total Assessment is a certain percentage of the fair market value that is determined by local assessors to be the total taxable value of land and additions on the property. | Land | Improvement |
|---|---|---|---|---|
| 2025 | $3,981 | $239,000 | $60,000 | $179,000 |
| 2024 | $3,981 | $271,000 | $60,000 | $211,000 |
| 2023 | $4,926 | $275,691 | $30,000 | $245,691 |
| 2022 | $4,373 | $223,531 | $30,000 | $193,531 |
| 2021 | $5,054 | $209,573 | $30,000 | $179,573 |
| 2020 | $4,101 | $170,452 | $30,000 | $140,452 |
| 2019 | $4,325 | $176,714 | $30,000 | $146,714 |
| 2018 | $3,956 | $161,643 | $18,000 | $143,643 |
| 2017 | $2,970 | $153,598 | $18,000 | $135,598 |
| 2016 | $2,700 | $135,836 | $18,000 | $117,836 |
| 2015 | $2,151 | $97,000 | $15,000 | $82,000 |
| 2014 | $2,151 | $97,000 | $15,000 | $82,000 |
Source: Public Records
Map
Nearby Homes
- 709 Hurstview Dr
- 813 Chase Cir
- 712 Pine St
- 756 Briarwood Ln
- 758 Briarwood Ln
- 624 Forest Ln
- 512 Shadowbrook Ln
- 608 W Redbud Dr
- 528 Buena Vista Dr
- 729 W Cheryl Ave
- 231 Elm St
- 1112 Karla Dr
- 416 Simmons Dr
- 209 W Cedar St
- 408 Simmons Dr
- 701 Harrison Ln
- 153 Sheri Ln
- 1016 Keith Dr
- 609 Norwood Dr
- 1208 Birch St
Your Personal Tour Guide
Ask me questions while you tour the home.