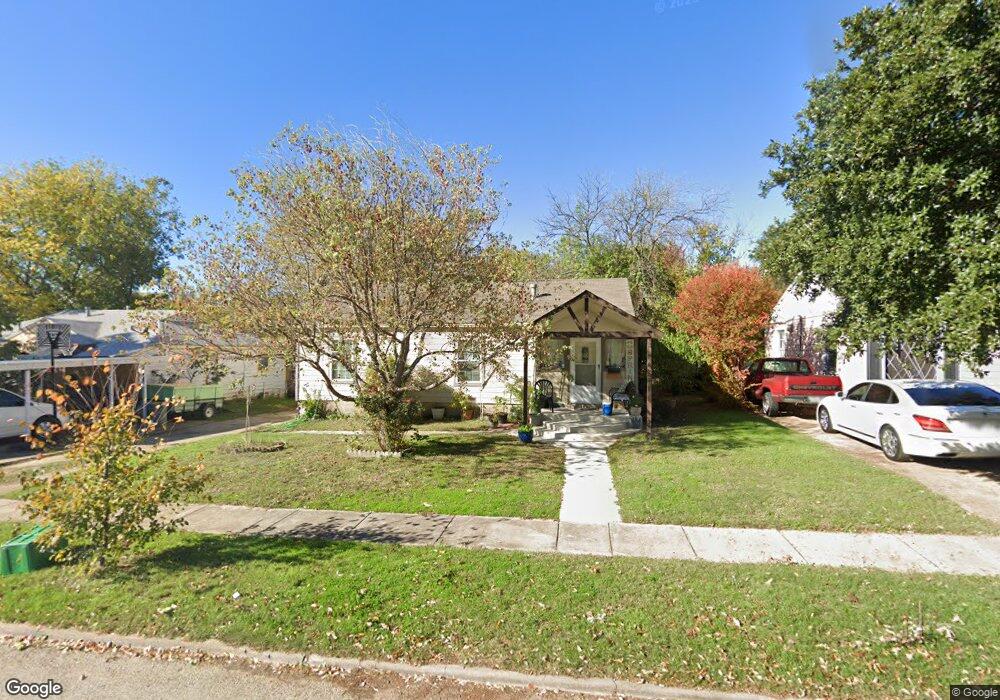
609 Ouida St Grand Prairie, TX 75051
Estimated Value: $200,570 - $231,000
2
Beds
1
Bath
928
Sq Ft
$230/Sq Ft
Est. Value
About This Home
This home is located at 609 Ouida St, Grand Prairie, TX 75051 and is currently estimated at $213,893, approximately $230 per square foot. 609 Ouida St is a home located in Dallas County with nearby schools including James Bowie Fine Arts Academy, Crosswinds High School, and Young Men's Leadership Academy at Kennedy Middle School.
Ownership History
Date
Name
Owned For
Owner Type
Purchase Details
Closed on
Jun 27, 2001
Sold by
White Harold Clayton
Bought by
Andrade Hector
Current Estimated Value
Home Financials for this Owner
Home Financials are based on the most recent Mortgage that was taken out on this home.
Original Mortgage
$57,005
Outstanding Balance
$21,920
Interest Rate
7.11%
Mortgage Type
FHA
Estimated Equity
$191,973
Create a Home Valuation Report for This Property
The Home Valuation Report is an in-depth analysis detailing your home's value as well as a comparison with similar homes in the area
Home Values in the Area
Average Home Value in this Area
Purchase History
| Date | Buyer | Sale Price | Title Company |
|---|---|---|---|
| Andrade Hector | -- | -- |
Source: Public Records
Mortgage History
| Date | Status | Borrower | Loan Amount |
|---|---|---|---|
| Open | Andrade Hector | $57,005 |
Source: Public Records
Tax History Compared to Growth
Tax History
| Year | Tax Paid | Tax Assessment Tax Assessment Total Assessment is a certain percentage of the fair market value that is determined by local assessors to be the total taxable value of land and additions on the property. | Land | Improvement |
|---|---|---|---|---|
| 2025 | $1,113 | $179,840 | $45,000 | $134,840 |
| 2024 | $1,113 | $179,840 | $45,000 | $134,840 |
| 2023 | $1,113 | $189,350 | $45,000 | $144,350 |
| 2022 | $3,711 | $146,300 | $40,000 | $106,300 |
| 2021 | $3,097 | $116,510 | $35,000 | $81,510 |
| 2020 | $3,194 | $113,290 | $35,000 | $78,290 |
| 2019 | $2,880 | $98,570 | $28,000 | $70,570 |
| 2018 | $1,847 | $63,200 | $20,000 | $43,200 |
| 2017 | $1,723 | $59,020 | $20,000 | $39,020 |
| 2016 | $1,476 | $50,540 | $17,000 | $33,540 |
| 2015 | $923 | $45,390 | $17,000 | $28,390 |
| 2014 | $923 | $44,110 | $17,000 | $27,110 |
Source: Public Records
Map
Nearby Homes