Estimated Value: $312,800 - $337,000
--
Bed
4
Baths
1,922
Sq Ft
$172/Sq Ft
Est. Value
About This Home
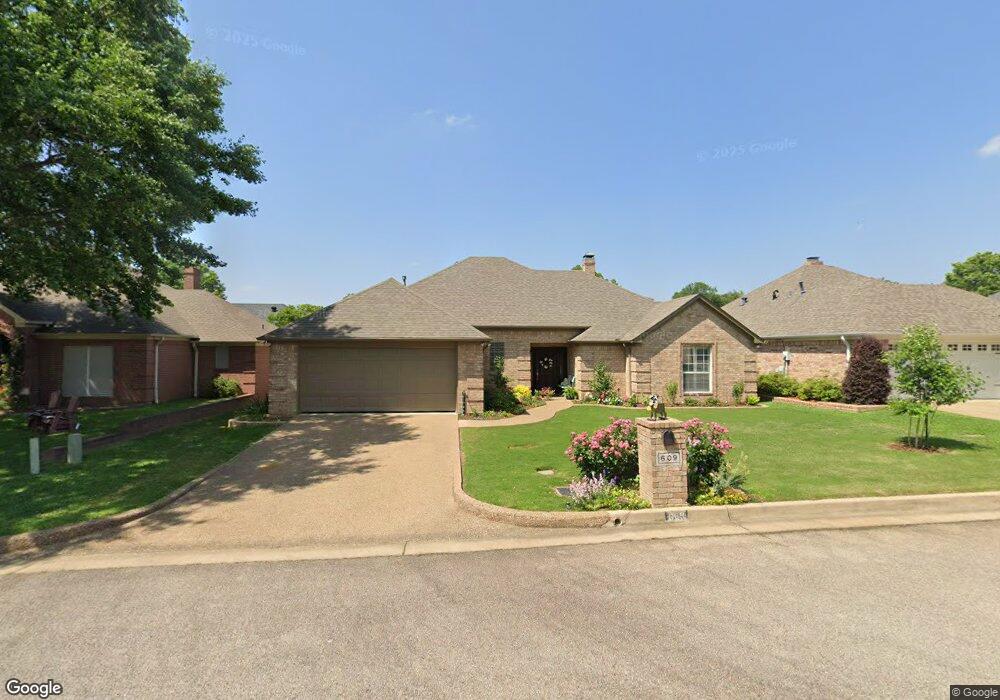
This home is located at 609 Paloma St, Tyler, TX 75703 and is currently estimated at $330,450, approximately $171 per square foot. 609 Paloma St is a home located in Smith County with nearby schools including Rice Elementary School, Hubbard Middle School, and Tyler Legacy High School.
Ownership History
Date
Name
Owned For
Owner Type
Purchase Details
Closed on
Jun 17, 2019
Sold by
Ellis John S and Ellis Susan J
Bought by
Miller Harold Steven and Miller Linda
Current Estimated Value
Purchase Details
Closed on
Apr 5, 2019
Sold by
Elzea Kay
Bought by
Ellis John S
Purchase Details
Closed on
Jun 11, 2013
Sold by
Adams Craig S
Bought by
Elzea Kay
Create a Home Valuation Report for This Property
The Home Valuation Report is an in-depth analysis detailing your home's value as well as a comparison with similar homes in the area
Home Values in the Area
Average Home Value in this Area
Purchase History
| Date | Buyer | Sale Price | Title Company |
|---|---|---|---|
| Miller Harold Steven | -- | None Available | |
| Ellis John S | -- | None Available | |
| Elzea Kay | -- | None Available |
Source: Public Records
Tax History Compared to Growth
Tax History
| Year | Tax Paid | Tax Assessment Tax Assessment Total Assessment is a certain percentage of the fair market value that is determined by local assessors to be the total taxable value of land and additions on the property. | Land | Improvement |
|---|---|---|---|---|
| 2025 | $1,583 | $304,682 | $27,390 | $277,292 |
| 2024 | $1,583 | $299,560 | $45,376 | $284,923 |
| 2023 | $4,747 | $308,102 | $45,376 | $262,726 |
| 2022 | $4,850 | $247,570 | $37,390 | $210,180 |
| 2021 | $5,309 | $253,028 | $37,390 | $215,638 |
| 2020 | $5,236 | $244,670 | $37,390 | $207,280 |
| 2019 | $4,002 | $183,019 | $36,301 | $146,718 |
| 2018 | $3,892 | $178,951 | $36,301 | $142,650 |
| 2017 | $3,820 | $178,951 | $36,301 | $142,650 |
| 2016 | $3,687 | $172,689 | $36,301 | $136,388 |
| 2015 | $3,705 | $171,055 | $36,301 | $134,754 |
| 2014 | $3,705 | $185,980 | $36,301 | $149,679 |
Source: Public Records
Map
Nearby Homes
- 704 Paloma St
- 5106 Cloverdale Dr
- 601 Carriage Dr
- 802 Carriage Dr
- 842 Carriage Dr
- 709 Top Hill Dr
- 608 Top Hill Dr
- 717 Meadow Creek Dr
- 1107 Larkspur Ln
- 709 W Rieck Rd
- 5401 Hollytree Dr
- 5401 Hollytree Dr Unit 1002
- 7434 Waterview Square
- 6052 N Park Central Ct
- 1202 Rice Rd
- 418 Boyd Ln
- 5802 Briar Creek Dr
- 14237 County Road 192
- 14195 County Road 192
- 14245 County Road 192
- 607 Paloma St
- 607 607 Paloma
- 701 Paloma St
- 608 Shiloh Ridge St
- 608 608 Shiloh Ridge
- 702 702 Shiloh Ridge St
- 606 Shiloh Ridge St
- 702 Shiloh Ridge St
- 606 606 Shiloh Ridge
- 605 Paloma St
- 703 Paloma St
- 700 Paloma St
- 608 608 Paloma
- 604 Shiloh Ridge St
- 604 604 Shiloh Ridge
- 704 Shiloh Ridge St
- 702 Paloma St
- 606 Paloma St
- 702 702 Paloma
- 603 603 Paloma St