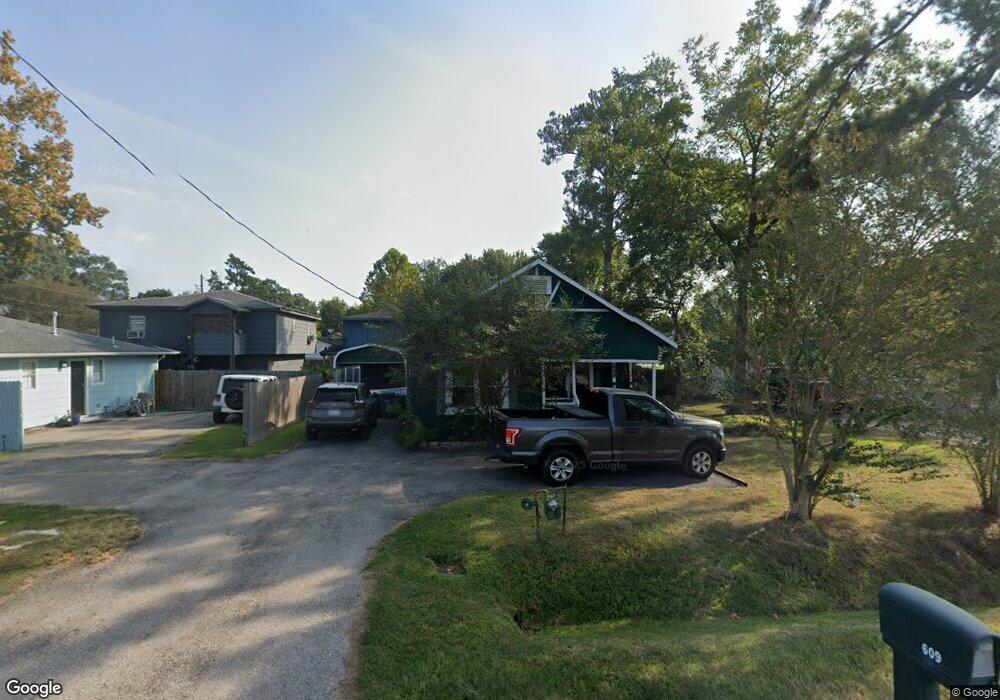
609 S Cherry St Tomball, TX 77375
Estimated Value: $188,228 - $318,000
2
Beds
1
Bath
1,144
Sq Ft
$207/Sq Ft
Est. Value
About This Home
This home is located at 609 S Cherry St, Tomball, TX 77375 and is currently estimated at $236,557, approximately $206 per square foot. 609 S Cherry St is a home located in Harris County with nearby schools including Tomball Elementary School, Tomball Intermediate School, and Tomball Junior High School.
Ownership History
Date
Name
Owned For
Owner Type
Purchase Details
Closed on
May 20, 2005
Sold by
Swinghammer Craig W and Swinghammer Amy
Bought by
Robertson Sharon E
Current Estimated Value
Purchase Details
Closed on
Mar 13, 2001
Sold by
Robinson Stanton B and Robinson Joy Lee
Bought by
Swinghammer Craig W and Swinghammer Amy
Home Financials for this Owner
Home Financials are based on the most recent Mortgage that was taken out on this home.
Original Mortgage
$33,200
Interest Rate
7.1%
Create a Home Valuation Report for This Property
The Home Valuation Report is an in-depth analysis detailing your home's value as well as a comparison with similar homes in the area
Home Values in the Area
Average Home Value in this Area
Purchase History
| Date | Buyer | Sale Price | Title Company |
|---|---|---|---|
| Robertson Sharon E | -- | Chicago Title Insurance Comp | |
| Swinghammer Craig W | -- | Alamo Title Company |
Source: Public Records
Mortgage History
| Date | Status | Borrower | Loan Amount |
|---|---|---|---|
| Previous Owner | Swinghammer Craig W | $33,200 |
Source: Public Records
Tax History
| Year | Tax Paid | Tax Assessment Tax Assessment Total Assessment is a certain percentage of the fair market value that is determined by local assessors to be the total taxable value of land and additions on the property. | Land | Improvement |
|---|---|---|---|---|
| 2025 | $63 | $169,858 | $85,470 | $84,388 |
| 2024 | $63 | $148,491 | $64,103 | $84,388 |
| 2023 | $63 | $112,993 | $64,103 | $48,890 |
| 2022 | $1,779 | $112,993 | $64,103 | $48,890 |
| 2021 | $1,701 | $71,731 | $18,837 | $52,894 |
| 2020 | $1,703 | $69,430 | $18,837 | $50,593 |
| 2019 | $1,751 | $69,430 | $18,837 | $50,593 |
| 2018 | $167 | $69,430 | $18,837 | $50,593 |
| 2017 | $1,750 | $69,430 | $18,837 | $50,593 |
| 2016 | $1,750 | $69,430 | $18,837 | $50,593 |
| 2015 | $740 | $69,430 | $18,837 | $50,593 |
| 2014 | $740 | $69,430 | $18,837 | $50,593 |
Source: Public Records
Map
Nearby Homes
- 109 Mcphail St
- TBD Clayton St
- 504 Percival St Unit A
- 200 S Cherry St
- 508 Clarence St
- 614 Percival St
- 18818 Cornelia Fields Ln
- 18723 Buttercup Farms Ln
- 19935 Epona Creek Dr
- 18707 Buttercup Farms Ln
- 18826 Cornelia Fields Ln
- 702 Clayton St
- 315 Mechanic St
- 0 Holiday St
- 701 Malone St
- TBD Mechanic St
- 0 N Sycamore St
- 429 Ash St
- lt 19 Mechanic Rd
- 712 Clarence St
Your Personal Tour Guide
Ask me questions while you tour the home.