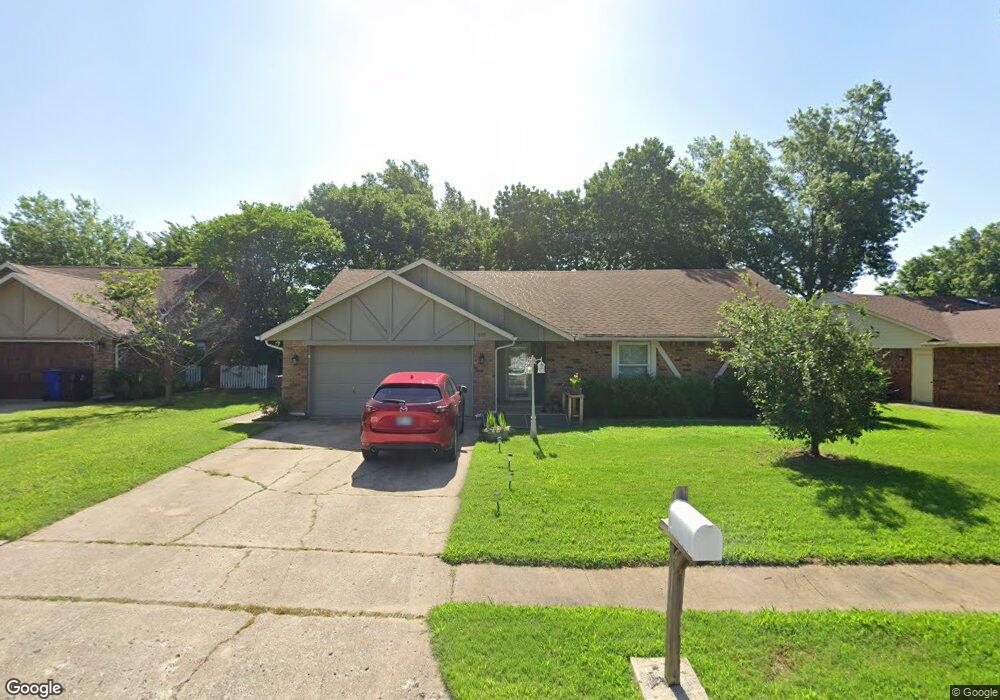
609 S Fir Ave Broken Arrow, OK 74012
Country Aire Estates NeighborhoodEstimated Value: $219,650 - $240,000
3
Beds
2
Baths
1,661
Sq Ft
$140/Sq Ft
Est. Value
About This Home
This home is located at 609 S Fir Ave, Broken Arrow, OK 74012 and is currently estimated at $232,663, approximately $140 per square foot. 609 S Fir Ave is a home located in Tulsa County with nearby schools including Peters Elementary School, Union 8th Grade Center, and Union 6th-7th Grade Center.
Ownership History
Date
Name
Owned For
Owner Type
Purchase Details
Closed on
Jan 21, 2011
Sold by
Lightcap Tony L and Lightcap Christina
Bought by
Lightcap Tony L
Current Estimated Value
Home Financials for this Owner
Home Financials are based on the most recent Mortgage that was taken out on this home.
Original Mortgage
$111,832
Outstanding Balance
$75,898
Interest Rate
4.84%
Mortgage Type
FHA
Estimated Equity
$156,765
Purchase Details
Closed on
Jun 6, 2003
Sold by
Krumme Paul D and Krumme Lagenia
Bought by
Perez Jose A
Purchase Details
Closed on
May 3, 2001
Sold by
Krumme Paul D and Krumme Lagenia
Bought by
Krumme Paul D and Krumme Lagenia
Purchase Details
Closed on
Jan 12, 2000
Sold by
Krumme Paul D and Krumme Lagenia
Bought by
Krumme Paul D and Krumme Lagenia
Purchase Details
Closed on
Jul 1, 1990
Create a Home Valuation Report for This Property
The Home Valuation Report is an in-depth analysis detailing your home's value as well as a comparison with similar homes in the area
Home Values in the Area
Average Home Value in this Area
Purchase History
| Date | Buyer | Sale Price | Title Company |
|---|---|---|---|
| Lightcap Tony L | -- | Executives Title & Escrow Co | |
| Lightcap Tony L | -- | Executives Title & Escrow Co | |
| Perez Jose A | $110,000 | Frisco Title Corp | |
| Krumme Paul D | -- | Tulsa Abstract & Title Co | |
| Krumme Paul D | -- | -- | |
| -- | $46,000 | -- |
Source: Public Records
Mortgage History
| Date | Status | Borrower | Loan Amount |
|---|---|---|---|
| Open | Lightcap Tony L | $111,832 |
Source: Public Records
Tax History Compared to Growth
Tax History
| Year | Tax Paid | Tax Assessment Tax Assessment Total Assessment is a certain percentage of the fair market value that is determined by local assessors to be the total taxable value of land and additions on the property. | Land | Improvement |
|---|---|---|---|---|
| 2025 | $2,394 | $18,232 | $2,802 | $15,430 |
| 2024 | $2,134 | $17,365 | $2,984 | $14,381 |
| 2023 | $2,134 | $16,538 | $2,745 | $13,793 |
| 2022 | $2,050 | $15,750 | $3,361 | $12,389 |
| 2021 | $1,958 | $15,000 | $3,201 | $11,799 |
| 2020 | $1,877 | $14,286 | $3,254 | $11,032 |
| 2019 | $1,874 | $14,286 | $3,254 | $11,032 |
| 2018 | $1,869 | $14,286 | $3,254 | $11,032 |
| 2017 | $1,811 | $13,666 | $3,113 | $10,553 |
| 2016 | $1,702 | $13,015 | $3,254 | $9,761 |
| 2015 | $1,703 | $13,015 | $3,254 | $9,761 |
| 2014 | $1,693 | $13,015 | $3,254 | $9,761 |
Source: Public Records
Map
Nearby Homes
- 517 S Hemlock Ave
- 521 S Kalanchoe Ave
- 3212 W Houston Place
- 2600 W Commercial St
- 2314 W Galveston Place
- 2604 W Broadway St
- 2509 W Broadway St
- 3309 W Knoxville St
- 2605 W Detroit St
- 2208 W Memphis St
- 507 S Redwood Ave
- 3812 W El Paso St
- 208 N Nyssa Ave
- 2008 W Dallas St
- 3309 W Freeport St
- 3843 W Galveston Place
- 3310 W Pittsburg Place
- 1916 W Indianola St
- 409 N Palm Ave
- 115 S Redbud Place
