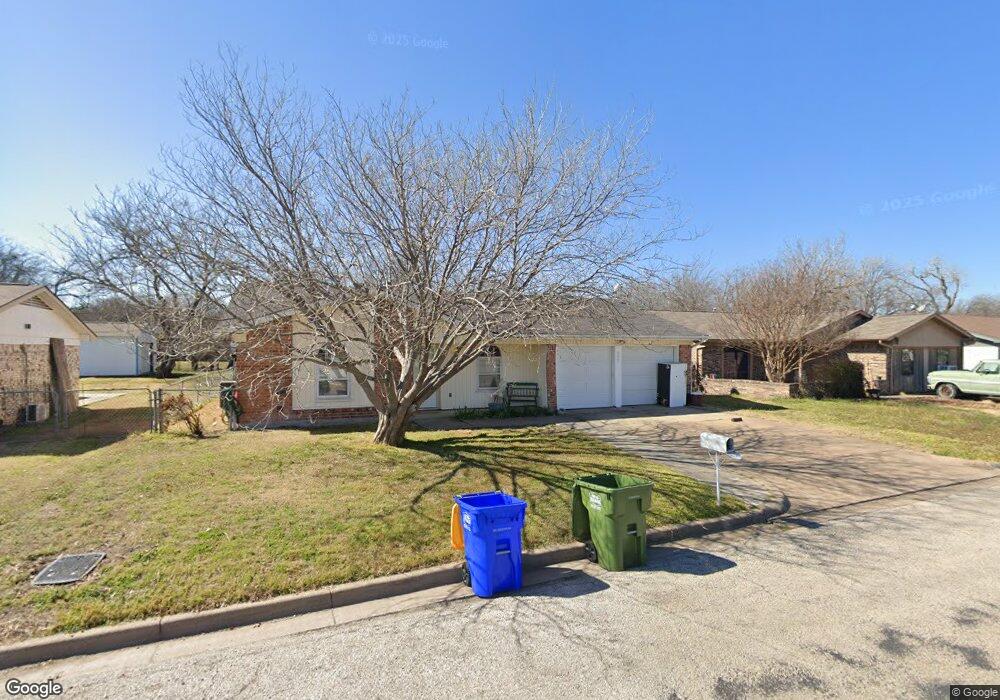
609 Saddle Rd Fort Worth, TX 76108
Estimated Value: $245,367 - $278,000
4
Beds
2
Baths
1,476
Sq Ft
$179/Sq Ft
Est. Value
About This Home
This home is located at 609 Saddle Rd, Fort Worth, TX 76108 and is currently estimated at $264,842, approximately $179 per square foot. 609 Saddle Rd is a home located in Tarrant County with nearby schools including North Elementary School, Brewer Middle School, and Tannahill Intermediate School.
Ownership History
Date
Name
Owned For
Owner Type
Purchase Details
Closed on
Oct 13, 2017
Sold by
Bigger Dreams Real Estate Solutions
Bought by
Rangel Arnulfo Nufy and Rangel Amecia
Current Estimated Value
Home Financials for this Owner
Home Financials are based on the most recent Mortgage that was taken out on this home.
Original Mortgage
$152,093
Outstanding Balance
$128,868
Interest Rate
4.37%
Mortgage Type
FHA
Estimated Equity
$135,974
Purchase Details
Closed on
Dec 21, 2015
Sold by
Manly Antione and Manly Lisa M
Bought by
Bigger Dreams Real Estate Solutions Llc
Purchase Details
Closed on
Mar 31, 2004
Sold by
Ray Jack Arthur and Ray Linda Ruth
Bought by
Manly Antione
Home Financials for this Owner
Home Financials are based on the most recent Mortgage that was taken out on this home.
Original Mortgage
$91,563
Interest Rate
5.59%
Mortgage Type
FHA
Create a Home Valuation Report for This Property
The Home Valuation Report is an in-depth analysis detailing your home's value as well as a comparison with similar homes in the area
Home Values in the Area
Average Home Value in this Area
Purchase History
| Date | Buyer | Sale Price | Title Company |
|---|---|---|---|
| Rangel Arnulfo Nufy | -- | None Available | |
| Bigger Dreams Real Estate Solutions Llc | -- | Rtc | |
| Manly Antione | -- | American Title |
Source: Public Records
Mortgage History
| Date | Status | Borrower | Loan Amount |
|---|---|---|---|
| Open | Rangel Arnulfo Nufy | $152,093 | |
| Previous Owner | Manly Antione | $91,563 |
Source: Public Records
Tax History Compared to Growth
Tax History
| Year | Tax Paid | Tax Assessment Tax Assessment Total Assessment is a certain percentage of the fair market value that is determined by local assessors to be the total taxable value of land and additions on the property. | Land | Improvement |
|---|---|---|---|---|
| 2025 | $3,569 | $221,469 | $36,070 | $185,399 |
| 2024 | $3,569 | $221,469 | $36,070 | $185,399 |
| 2023 | $4,937 | $223,124 | $36,070 | $187,054 |
| 2022 | $5,113 | $194,166 | $25,000 | $169,166 |
| 2021 | $4,721 | $171,623 | $25,000 | $146,623 |
| 2020 | $4,414 | $159,301 | $25,000 | $134,301 |
| 2019 | $4,351 | $153,013 | $25,000 | $128,013 |
| 2018 | $3,955 | $137,502 | $11,000 | $126,502 |
| 2017 | $3,065 | $104,866 | $11,000 | $93,866 |
| 2016 | $3,237 | $110,779 | $11,000 | $99,779 |
| 2015 | $2,169 | $87,800 | $11,000 | $76,800 |
| 2014 | $2,169 | $87,800 | $11,000 | $76,800 |
Source: Public Records
Map
Nearby Homes
- 633 Lariat Ln
- 8814 Rockway St
- 8401 Clifford St
- 627 Hallvale Dr
- 8133 Foxfire Ln
- 813 Hackamore St
- 8113 Foxfire Ln
- 304 Lockwood St
- 311 Russell St
- 8814 Clifford St
- 308 Hallvale Dr
- 8811 Silver Creek Rd
- 8321 Raymond Ave
- 8417 Omaha Dr
- 203 East Place
- 857 Mccully St
- 1800 N Las Vegas Trail
- 914 Ronald St
- 9005 Glenn Dr
- 200 Waynell St