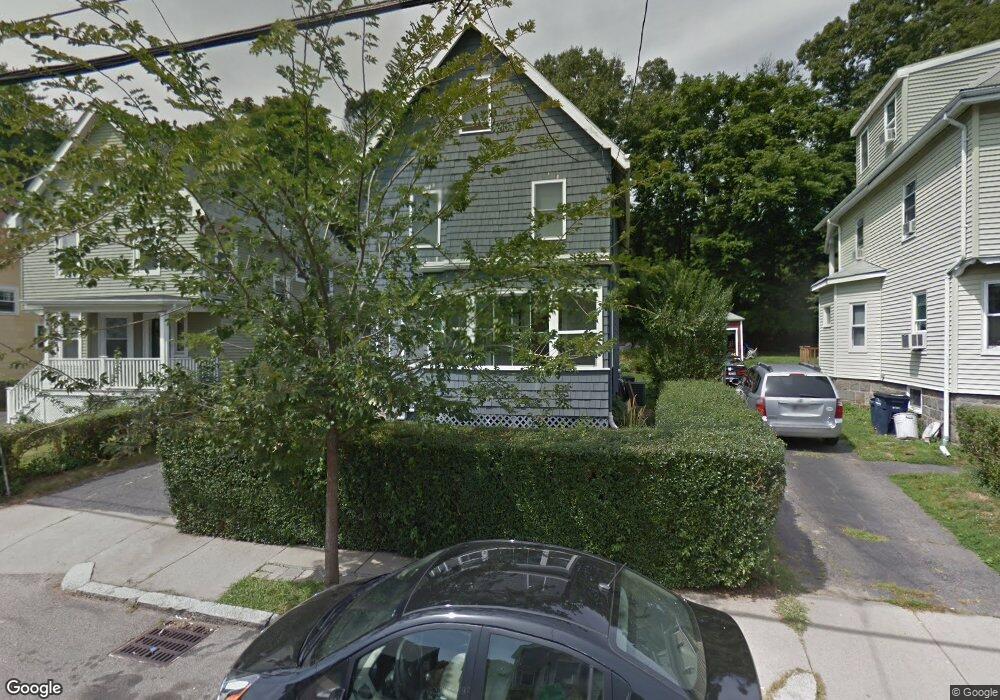
609 South St Roslindale, MA 02131
Roslindale NeighborhoodEstimated Value: $737,000 - $996,317
4
Beds
2
Baths
1,514
Sq Ft
$570/Sq Ft
Est. Value
About This Home
This home is located at 609 South St, Roslindale, MA 02131 and is currently estimated at $862,829, approximately $569 per square foot. 609 South St is a home located in Suffolk County with nearby schools including Brooke Charter School Roslindale, The Croft School - Jamaica Plain, and Sacred Heart STEM School.
Ownership History
Date
Name
Owned For
Owner Type
Purchase Details
Closed on
Sep 28, 2009
Sold by
Hinchliffe Nathan
Bought by
Hinchliffe Nathan and Duprey Maribel
Current Estimated Value
Purchase Details
Closed on
Dec 19, 2008
Sold by
Morgan Staley Abs Capt and Wells Fargo Bk
Bought by
Hinchiffe Nathan and Duprey Maribel
Purchase Details
Closed on
Jan 17, 2008
Sold by
Rosario Jose D and Wells Fargo Bk
Bought by
Wells Fargo Bk
Purchase Details
Closed on
Oct 31, 2006
Sold by
Curet Ana and Delgado Ana
Bought by
Rosario Jose D
Purchase Details
Closed on
May 19, 2005
Sold by
Delgado Ana M and Delgado Samuel
Bought by
Curet Ana
Purchase Details
Closed on
Nov 29, 1989
Sold by
South St Rt
Bought by
Resource Fin Grp Inc
Create a Home Valuation Report for This Property
The Home Valuation Report is an in-depth analysis detailing your home's value as well as a comparison with similar homes in the area
Home Values in the Area
Average Home Value in this Area
Purchase History
| Date | Buyer | Sale Price | Title Company |
|---|---|---|---|
| Hinchliffe Nathan | -- | -- | |
| Hinchiffe Nathan | $258,000 | -- | |
| Wells Fargo Bk | $293,250 | -- | |
| Rosario Jose D | $425,000 | -- | |
| Curet Ana | -- | -- | |
| Resource Fin Grp Inc | $70,000 | -- |
Source: Public Records
Mortgage History
| Date | Status | Borrower | Loan Amount |
|---|---|---|---|
| Open | Resource Fin Grp Inc | $30,000 | |
| Open | Resource Fin Grp Inc | $292,000 | |
| Closed | Resource Fin Grp Inc | $293,512 |
Source: Public Records
Tax History Compared to Growth
Tax History
| Year | Tax Paid | Tax Assessment Tax Assessment Total Assessment is a certain percentage of the fair market value that is determined by local assessors to be the total taxable value of land and additions on the property. | Land | Improvement |
|---|---|---|---|---|
| 2025 | $9,432 | $814,500 | $263,500 | $551,000 |
| 2024 | $8,505 | $780,300 | $223,300 | $557,000 |
| 2023 | $8,380 | $780,300 | $223,300 | $557,000 |
| 2022 | $7,581 | $696,800 | $199,400 | $497,400 |
| 2021 | $7,259 | $680,300 | $199,400 | $480,900 |
| 2020 | $6,490 | $614,600 | $187,800 | $426,800 |
| 2019 | $5,995 | $568,800 | $163,300 | $405,500 |
| 2018 | $5,521 | $526,800 | $163,300 | $363,500 |
| 2017 | $5,579 | $526,800 | $163,300 | $363,500 |
| 2016 | $5,627 | $511,500 | $163,300 | $348,200 |
| 2015 | $5,637 | $465,500 | $142,000 | $323,500 |
| 2014 | $4,458 | $354,400 | $137,100 | $217,300 |
Source: Public Records
Map
Nearby Homes
- 620 South St
- 4031 Washington St
- 4012 Washington St
- 19 Delford St
- 19 Delford St Unit 1
- 173 Brookway Rd
- 18-20 Northbourne Rd Unit 18
- 348-350 Hyde Park Ave Unit 2
- 187 Florence St Unit 2L
- 108 Florence St Unit 3
- 108 Florence St Unit 1
- 108 Florence St Unit 4
- 375 Hyde Park Ave Unit 3
- 50 Southbourne Rd
- 2 Weld Hill St Unit PH2
- 158 Wachusett St Unit 3
- 178 Hyde Park Ave Unit 3
- 140 Wachusett St
- 143-171 Hyde Park Ave Unit 169A
- 31 Rodman St Unit 2
- 613 South St
- 607 South St
- 615 South St
- 605 South St
- 617 South St
- 617 South St Unit 2
- 617 South St Unit 1
- 603 South St
- 610 South St
- 610 South St Unit 1
- 610 South St Unit 3
- 610 South St Unit 2
- 608 South St
- 608 South St Unit 1
- 612 South St
- 621 South St
- 601 South St
- 614 South St
- 614 South St Unit 1
- 604 South St