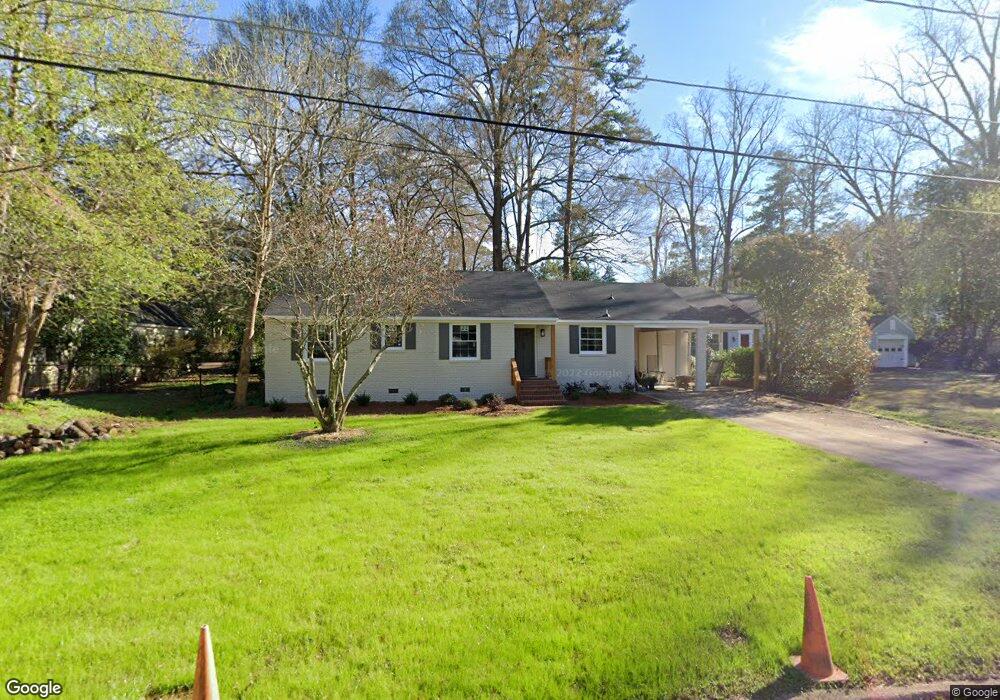
609 Virginia Ave Lagrange, GA 30240
Estimated Value: $271,257 - $328,000
3
Beds
3
Baths
2,073
Sq Ft
$141/Sq Ft
Est. Value
About This Home
This home is located at 609 Virginia Ave, Lagrange, GA 30240 and is currently estimated at $292,564, approximately $141 per square foot. 609 Virginia Ave is a home located in Troup County with nearby schools including Hollis Hand Elementary School, Ethel W. Kight Elementary School, and Franklin Forest Elementary School.
Ownership History
Date
Name
Owned For
Owner Type
Purchase Details
Closed on
Jul 19, 2021
Sold by
Newman Alan G
Bought by
Newman Dawn D
Current Estimated Value
Purchase Details
Closed on
Aug 11, 2003
Sold by
Anne S Duraski
Bought by
Denney Dawn
Purchase Details
Closed on
Sep 4, 2002
Sold by
Bryant Bretley H and Bryant Carole W
Bought by
Anne S Duraski
Purchase Details
Closed on
Jan 29, 1996
Sold by
Kemp Chris
Bought by
Bryant Bretley H and Bryant Carole W
Purchase Details
Closed on
Oct 26, 1988
Sold by
Marilyn Dodson
Bought by
Kemp Chris
Purchase Details
Closed on
Mar 30, 1976
Sold by
Davis
Bought by
Marilyn Dodson
Purchase Details
Closed on
Jul 12, 1974
Sold by
Solomon
Bought by
Davis
Purchase Details
Closed on
Mar 9, 1971
Bought by
Solomon
Purchase Details
Closed on
Mar 1, 1971
Sold by
Daniel Lbr Co
Create a Home Valuation Report for This Property
The Home Valuation Report is an in-depth analysis detailing your home's value as well as a comparison with similar homes in the area
Purchase History
| Date | Buyer | Sale Price | Title Company |
|---|---|---|---|
| Newman Dawn D | -- | -- | |
| Denney Dawn | $125,000 | -- | |
| Anne S Duraski | $123,900 | -- | |
| Bryant Bretley H | $86,000 | -- | |
| Kemp Chris | $57,900 | -- | |
| Marilyn Dodson | -- | -- | |
| Davis | -- | -- | |
| Solomon | -- | -- | |
| -- | -- | -- |
Source: Public Records
Tax History
| Year | Tax Paid | Tax Assessment Tax Assessment Total Assessment is a certain percentage of the fair market value that is determined by local assessors to be the total taxable value of land and additions on the property. | Land | Improvement |
|---|---|---|---|---|
| 2025 | $2,386 | $93,184 | $18,000 | $75,184 |
| 2024 | $2,203 | $82,760 | $18,000 | $64,760 |
| 2023 | $1,936 | $72,968 | $18,000 | $54,968 |
| 2022 | $1,783 | $65,888 | $14,000 | $51,888 |
| 2021 | $1,697 | $58,240 | $14,000 | $44,240 |
| 2020 | $1,697 | $58,240 | $14,000 | $44,240 |
| 2019 | $1,496 | $51,600 | $9,440 | $42,160 |
| 2018 | $1,435 | $49,560 | $9,440 | $40,120 |
| 2017 | $1,292 | $44,812 | $9,452 | $35,360 |
| 2016 | $1,276 | $44,305 | $9,452 | $34,853 |
| 2015 | $1,279 | $44,305 | $9,452 | $34,853 |
| 2014 | $1,259 | $43,586 | $9,452 | $34,134 |
| 2013 | -- | $47,876 | $9,452 | $38,424 |
Source: Public Records
Map
Nearby Homes
- 203 Waverly Way
- 598 Edmondson Ave
- 216 E Lane Cir
- 105 Saynor Cir
- 120 Saynor Cir
- 705 Piney Woods Dr
- 119 College Ave
- 208 Boulevard
- 206 Broad St
- 405 W Broome St Unit 2
- 405 W Broome St Unit 3
- 405 W Broome St Unit 4
- 405 W Broome St Unit 1
- 405 W Broome St Unit 5
- 304 Boulevard
- 416 Park Ave
- 421 College Ave
- 217 Jefferson St
- 0 N Lee St Unit 10550825
- 222 Beechwood Cir
- 607 Virginia Ave
- 606 Edmondson Ave
- 206 Waverly Way
- 208 Waverly Way
- 204 Waverly Way Unit 52/53
- 204 Waverly Way
- 605 Virginia Ave
- 610 Virginia Ave
- 606 Virginia Ave
- 603 Virginia Ave
- 612 Virginia Ave
- 608 Virginia Ave
- 604 Edmondson Ave
- 602 Edmondson Ave
- 200 Waverly Way
- 601 Virginia Ave
- 301 Waverly Way
- 604 Virginia Ave
- 207 Waverly Way
- 209 Waverly Way
Your Personal Tour Guide
Ask me questions while you tour the home.