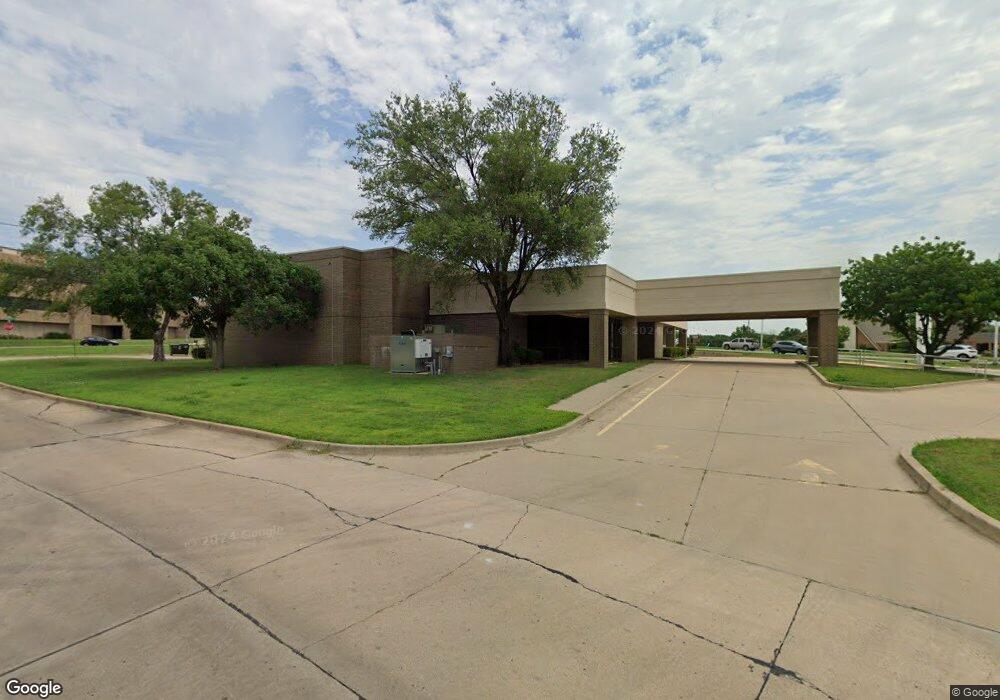
609 Virginia Ave Ponca City, OK 74601
Estimated Value: $2,123,649
--
Bed
5
Baths
9,487
Sq Ft
$224/Sq Ft
Est. Value
About This Home
This home is located at 609 Virginia Ave, Ponca City, OK 74601 and is currently estimated at $2,123,649, approximately $223 per square foot. 609 Virginia Ave is a home located in Kay County with nearby schools including Roosevelt Elementary School, Ponca City East Middle School, and Ponca City West Middle School.
Ownership History
Date
Name
Owned For
Owner Type
Purchase Details
Closed on
Mar 6, 2019
Sold by
Abtcn Iii Llc
Bought by
Contemporary Property Llc
Current Estimated Value
Home Financials for this Owner
Home Financials are based on the most recent Mortgage that was taken out on this home.
Original Mortgage
$1,100,000
Outstanding Balance
$440,955
Interest Rate
4.4%
Mortgage Type
Commercial
Estimated Equity
$1,682,694
Purchase Details
Closed on
Mar 22, 2018
Sold by
Midwest Oncology Re Llc
Bought by
Abtcn Iii Llc
Home Financials for this Owner
Home Financials are based on the most recent Mortgage that was taken out on this home.
Original Mortgage
$1,100,000
Interest Rate
4.32%
Mortgage Type
Commercial
Purchase Details
Closed on
Jan 15, 2015
Sold by
St Joseph Cancer Center Of Northern Okla
Bought by
Midwest Oncology Re Llc
Purchase Details
Closed on
Nov 6, 1996
Sold by
Joseph St and Joseph Reg Med Cntr
Bought by
Joseph St and Joseph Cancer Cntr
Create a Home Valuation Report for This Property
The Home Valuation Report is an in-depth analysis detailing your home's value as well as a comparison with similar homes in the area
Home Values in the Area
Average Home Value in this Area
Purchase History
| Date | Buyer | Sale Price | Title Company |
|---|---|---|---|
| Contemporary Property Llc | $1,375,000 | First American Title Ins Co | |
| Abtcn Iii Llc | $1,679,500 | The Oklahoma City Abstract & | |
| Midwest Oncology Re Llc | $1,122,000 | None Available | |
| Joseph St | $390,000 | -- |
Source: Public Records
Mortgage History
| Date | Status | Borrower | Loan Amount |
|---|---|---|---|
| Open | Contemporary Property Llc | $1,100,000 | |
| Previous Owner | Abtcn Iii Llc | $1,100,000 |
Source: Public Records
Tax History Compared to Growth
Tax History
| Year | Tax Paid | Tax Assessment Tax Assessment Total Assessment is a certain percentage of the fair market value that is determined by local assessors to be the total taxable value of land and additions on the property. | Land | Improvement |
|---|---|---|---|---|
| 2024 | $14,968 | $158,100 | $34,931 | $123,169 |
| 2023 | $14,519 | $150,571 | $34,931 | $115,640 |
| 2022 | $14,393 | $151,250 | $34,931 | $116,319 |
| 2021 | $14,467 | $151,250 | $34,931 | $116,319 |
| 2020 | $14,317 | $151,250 | $34,931 | $116,319 |
| 2019 | $17,651 | $184,745 | $34,931 | $149,814 |
| 2018 | $12,562 | $129,732 | $41,917 | $87,815 |
| 2017 | $12,110 | $123,554 | $41,917 | $81,637 |
| 2016 | $12,221 | $123,420 | $41,917 | $81,503 |
| 2015 | $13,584 | $136,565 | $41,917 | $94,648 |
| 2014 | $13,480 | $138,103 | $41,917 | $96,186 |
Source: Public Records
Map
Nearby Homes
- 1128 N 14th St
- 3651 N 14th St
- 1600 Monument Rd
- 1412 Donahoe Dr
- 734 E Albany Ave
- 106 Elmwood Ave
- 121 Hillside Ave
- 1013 N 7th St
- 2000 N 5th St
- 2005 N 4th St
- 304 E Detroit Ave
- 1906 Meadowbrook St
- 1916 Meadowbrook St
- 2208 El Camino St
- 800 Sugar Maple Dr
- 113 E Fresno Ave
- 2223 Turner St
- 2216 El Camino St
- 1610 Meadowbrook Dr
- TBD 5th and Windsor
- 1408 E Hartford Ave
- 545 Virginia Ave
- 1132 N 14th St
- 548 Virginia Ave
- 1304 E Gary Ave
- 544 Virginia Ave
- 1300 E Gary Ave
- 539 Virginia Ave
- 542 Virginia Ave
- 1127 N 14th St
- 1120 E Gary Ave
- 3800 N 14th St
- 1112 E Hartford Ave
- 537 Virginia Ave
- 538 Virginia Ave
- 535 Virginia Ave
- 1116 E Gary Ave
- 1110 E Hartford Ave
- 1116 N 14th St
- 534 Virginia Ave