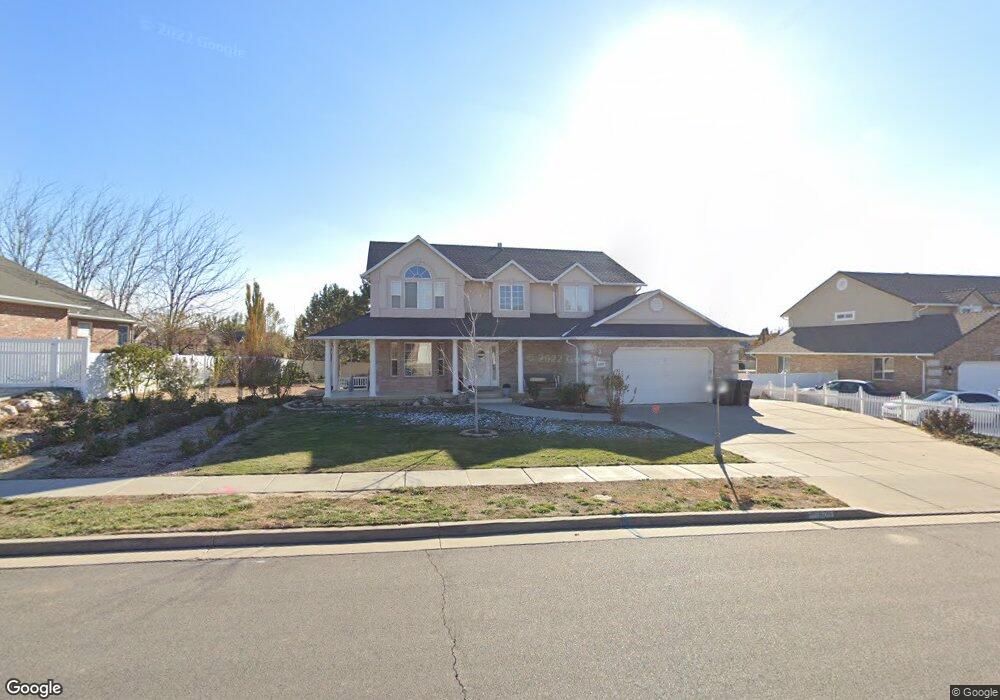
609 W 2300 S Unit 42 Syracuse, UT 84075
Estimated Value: $686,000 - $791,000
5
Beds
4
Baths
3,411
Sq Ft
$217/Sq Ft
Est. Value
About This Home
This home is located at 609 W 2300 S Unit 42, Syracuse, UT 84075 and is currently estimated at $739,241, approximately $216 per square foot. 609 W 2300 S Unit 42 is a home located in Davis County with nearby schools including Bluff Ridge Elementary, Legacy Junior High School, and Clearfield High School.
Ownership History
Date
Name
Owned For
Owner Type
Purchase Details
Closed on
Mar 14, 2022
Sold by
Egan Lloyd C
Bought by
Pressley David Evan and Pressley Jeanette Cynthia
Current Estimated Value
Home Financials for this Owner
Home Financials are based on the most recent Mortgage that was taken out on this home.
Original Mortgage
$540,000
Outstanding Balance
$503,629
Interest Rate
3.92%
Mortgage Type
New Conventional
Estimated Equity
$235,612
Purchase Details
Closed on
Dec 9, 2016
Sold by
Harris Florence
Bought by
Egan Lloyd C and Egan Tamra Harris
Purchase Details
Closed on
Oct 4, 2016
Sold by
Harris Florence and Harris Edison G
Bought by
Egan Lloyd C and Egan Harris
Purchase Details
Closed on
Dec 21, 1999
Sold by
Waters Dennis
Bought by
Harris Edison G
Purchase Details
Closed on
Sep 2, 1998
Sold by
T B E Investments Llc
Bought by
Waters Dennis
Create a Home Valuation Report for This Property
The Home Valuation Report is an in-depth analysis detailing your home's value as well as a comparison with similar homes in the area
Home Values in the Area
Average Home Value in this Area
Purchase History
| Date | Buyer | Sale Price | Title Company |
|---|---|---|---|
| Pressley David Evan | -- | Stewart Title Company | |
| Egan Lloyd C | -- | -- | |
| Egan Lloyd C | -- | None Available | |
| Harris Edison G | -- | Founders Title Co | |
| Waters Dennis | -- | Bonneville Title Company Inc |
Source: Public Records
Mortgage History
| Date | Status | Borrower | Loan Amount |
|---|---|---|---|
| Open | Pressley David Evan | $540,000 |
Source: Public Records
Tax History Compared to Growth
Tax History
| Year | Tax Paid | Tax Assessment Tax Assessment Total Assessment is a certain percentage of the fair market value that is determined by local assessors to be the total taxable value of land and additions on the property. | Land | Improvement |
|---|---|---|---|---|
| 2025 | $3,392 | $327,250 | $128,486 | $198,764 |
| 2024 | $3,233 | $314,050 | $109,715 | $204,335 |
| 2023 | $3,113 | $551,000 | $152,674 | $398,326 |
| 2022 | $3,339 | $323,950 | $87,406 | $236,544 |
| 2021 | $710 | $407,000 | $129,562 | $277,438 |
| 2020 | $2,455 | $357,000 | $111,124 | $245,876 |
| 2019 | $2,396 | $344,000 | $110,748 | $233,252 |
| 2018 | $2,407 | $343,000 | $105,810 | $237,190 |
| 2016 | $2,076 | $155,155 | $40,534 | $114,621 |
| 2015 | $2,165 | $150,315 | $40,534 | $109,781 |
| 2014 | $2,113 | $153,218 | $40,534 | $112,684 |
| 2013 | -- | $136,940 | $38,525 | $98,415 |
Source: Public Records
Map
Nearby Homes