Estimated Value: $510,980 - $553,000
5
Beds
4
Baths
3,245
Sq Ft
$165/Sq Ft
Est. Value
About This Home
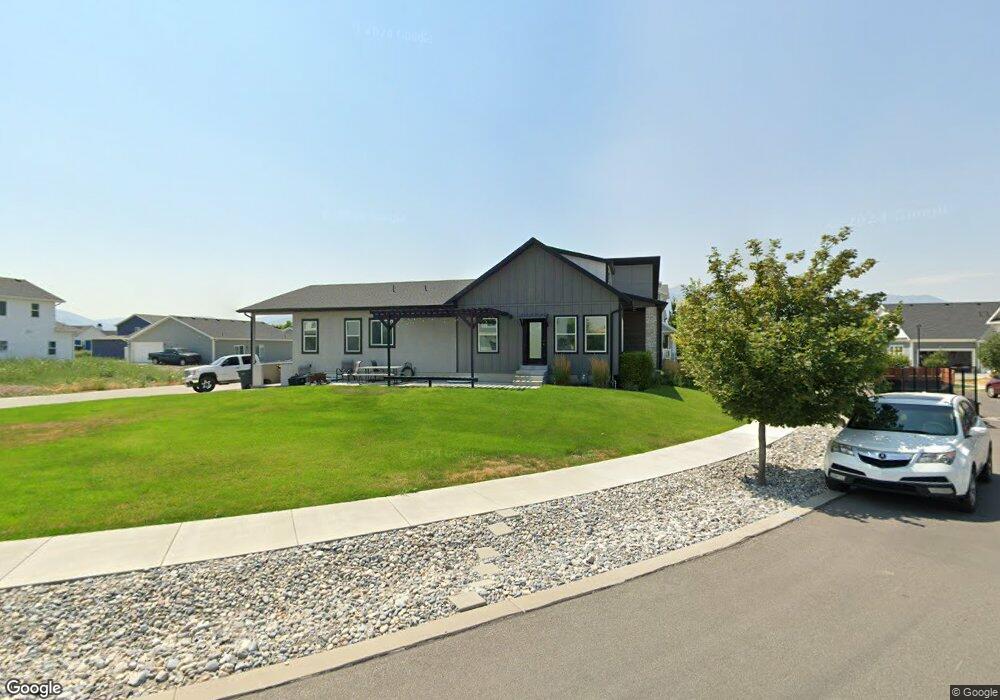
This home is located at 609 W 50 N, Hyrum, UT 84319 and is currently estimated at $535,245, approximately $164 per square foot. 609 W 50 N is a home located in Cache County with nearby schools including Lincoln School, South Cache Middle School, and Mountain Crest High School.
Ownership History
Date
Name
Owned For
Owner Type
Purchase Details
Closed on
Jul 23, 2025
Sold by
Larchar Dennis and Larchar Beth
Bought by
Msf18 Llc
Current Estimated Value
Purchase Details
Closed on
Apr 2, 2018
Sold by
Miller Spencer and Miller Tiffany
Bought by
Larchar Dennis and Larchar Beth
Purchase Details
Closed on
Nov 30, 2016
Sold by
Miller Spencer
Bought by
Miller Spencer and Miller Tiffany
Home Financials for this Owner
Home Financials are based on the most recent Mortgage that was taken out on this home.
Original Mortgage
$275,793
Interest Rate
3.54%
Mortgage Type
FHA
Purchase Details
Closed on
Apr 12, 2016
Sold by
Lsh Development Llc
Bought by
Solid Homes Inc and Lifestyle Homes
Home Financials for this Owner
Home Financials are based on the most recent Mortgage that was taken out on this home.
Original Mortgage
$8,000
Interest Rate
3.64%
Mortgage Type
Seller Take Back
Create a Home Valuation Report for This Property
The Home Valuation Report is an in-depth analysis detailing your home's value as well as a comparison with similar homes in the area
Home Values in the Area
Average Home Value in this Area
Purchase History
| Date | Buyer | Sale Price | Title Company |
|---|---|---|---|
| Msf18 Llc | -- | Hickman Land Title | |
| Msf18 Llc | -- | Hickman Land Title | |
| Larchar Dennis | -- | Hickman Land Title | |
| Miller Spencer | -- | Hickman Land Title Co | |
| Miller Spencer | -- | Hickman Land Title Co | |
| Solid Homes Inc | -- | Hickman Land Title Company |
Source: Public Records
Mortgage History
| Date | Status | Borrower | Loan Amount |
|---|---|---|---|
| Previous Owner | Miller Spencer | $275,793 | |
| Previous Owner | Solid Homes Inc | $8,000 |
Source: Public Records
Tax History Compared to Growth
Tax History
| Year | Tax Paid | Tax Assessment Tax Assessment Total Assessment is a certain percentage of the fair market value that is determined by local assessors to be the total taxable value of land and additions on the property. | Land | Improvement |
|---|---|---|---|---|
| 2025 | $2,126 | $305,250 | $0 | $0 |
| 2024 | $2,048 | $274,585 | $0 | $0 |
| 2023 | $2,315 | $296,780 | $0 | $0 |
| 2022 | $2,416 | $296,780 | $0 | $0 |
| 2021 | $2,052 | $388,379 | $73,000 | $315,379 |
| 2020 | $1,955 | $347,243 | $73,000 | $274,243 |
| 2019 | $2,049 | $342,243 | $68,000 | $274,243 |
| 2018 | $1,937 | $312,860 | $68,000 | $244,860 |
| 2017 | $1,976 | $165,660 | $0 | $0 |
| 2016 | $2,021 | $68,000 | $0 | $0 |
Source: Public Records
Map
Nearby Homes
- 619 W 50 N Unit 19
- 619 W 50 N
- 629 W 50 N Unit 20
- 629 W 50 N
- 626 W 20 N Unit 23
- 596 W 50 N Unit 14
- 600 W 50 N
- 600 W 50 N Unit 13
- 44 N 575 W Unit 15
- 44 N 575 W
- 646 W 20 N Unit 24
- 34 N 575 W Unit 16
- 620 W 50 N Unit 12
- 620 W 50 N
- 639 W 50 N
- 632 W 50 N
- 28 N 575 W Unit 17
- 652 W 20 N
- 652 W 20 N Unit 25
- 591 W 60 N