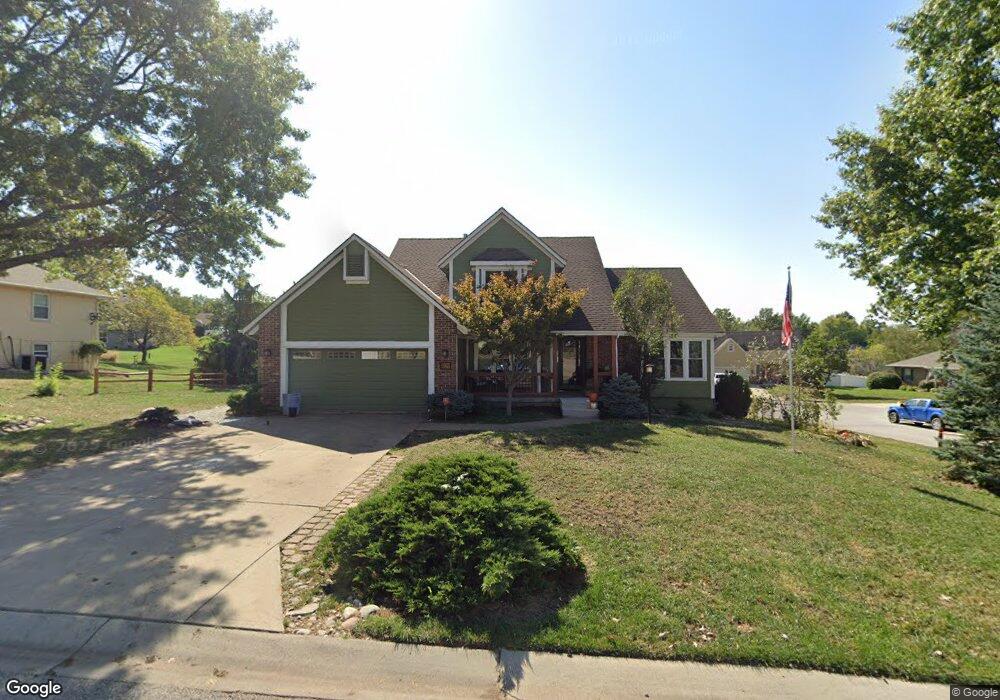
609 W Maple St Raymore, MO 64083
Estimated Value: $357,000 - $401,000
3
Beds
2
Baths
2,691
Sq Ft
$141/Sq Ft
Est. Value
About This Home
This home is located at 609 W Maple St, Raymore, MO 64083 and is currently estimated at $380,657, approximately $141 per square foot. 609 W Maple St is a home located in Cass County with nearby schools including Raymore Elementary School, Raymore-Peculiar East Middle School, and Raymore-Peculiar Senior High School.
Ownership History
Date
Name
Owned For
Owner Type
Purchase Details
Closed on
Apr 30, 2007
Sold by
Hammer Scott C and Hammer Annette M
Bought by
Brock Gregory B and Brock Denise K
Current Estimated Value
Home Financials for this Owner
Home Financials are based on the most recent Mortgage that was taken out on this home.
Original Mortgage
$172,000
Outstanding Balance
$103,194
Interest Rate
6.1%
Mortgage Type
New Conventional
Estimated Equity
$277,463
Create a Home Valuation Report for This Property
The Home Valuation Report is an in-depth analysis detailing your home's value as well as a comparison with similar homes in the area
Home Values in the Area
Average Home Value in this Area
Purchase History
| Date | Buyer | Sale Price | Title Company |
|---|---|---|---|
| Brock Gregory B | -- | -- |
Source: Public Records
Mortgage History
| Date | Status | Borrower | Loan Amount |
|---|---|---|---|
| Open | Brock Gregory B | $172,000 |
Source: Public Records
Tax History
| Year | Tax Paid | Tax Assessment Tax Assessment Total Assessment is a certain percentage of the fair market value that is determined by local assessors to be the total taxable value of land and additions on the property. | Land | Improvement |
|---|---|---|---|---|
| 2025 | $3,488 | $48,470 | $5,920 | $42,550 |
| 2024 | $3,488 | $42,860 | $5,380 | $37,480 |
| 2023 | $3,483 | $42,860 | $5,380 | $37,480 |
| 2022 | $3,128 | $38,240 | $5,380 | $32,860 |
| 2021 | $3,129 | $38,240 | $5,380 | $32,860 |
| 2020 | $3,074 | $36,900 | $5,380 | $31,520 |
| 2019 | $2,967 | $36,900 | $5,380 | $31,520 |
| 2018 | $2,758 | $33,120 | $4,600 | $28,520 |
| 2017 | $2,520 | $33,120 | $4,600 | $28,520 |
| 2016 | $2,520 | $31,410 | $4,600 | $26,810 |
| 2015 | $2,522 | $31,410 | $4,600 | $26,810 |
| 2014 | $2,523 | $31,410 | $4,600 | $26,810 |
| 2013 | -- | $31,410 | $4,600 | $26,810 |
Source: Public Records
Map
Nearby Homes
- 108 Rainbow Cir
- 600 W Buena Vista Dr
- 205 N Pacific Ct
- 201 Johnston Dr
- 208 N Pacific Ct
- 105 N Landcaster Dr
- 205 Johnston Pkwy
- 222 N Madison St
- 416 S Jefferson St
- 615 N Conway St
- 506 S Adams St
- 1105 Brookside Place
- 113 N Eastglen Dr
- 204 N Pointe Ln
- 901 W Lucy Webb Rd
- 219 Pointe Ln
- 1206 Johnston Dr
- 713 S Sunset Ln
- 317 & 319 W Foxwood Dr
- 1108 Yokley Dr
Your Personal Tour Guide
Ask me questions while you tour the home.