609 W Maple St Raymore, MO 64083
Estimated Value: $358,000 - $407,000
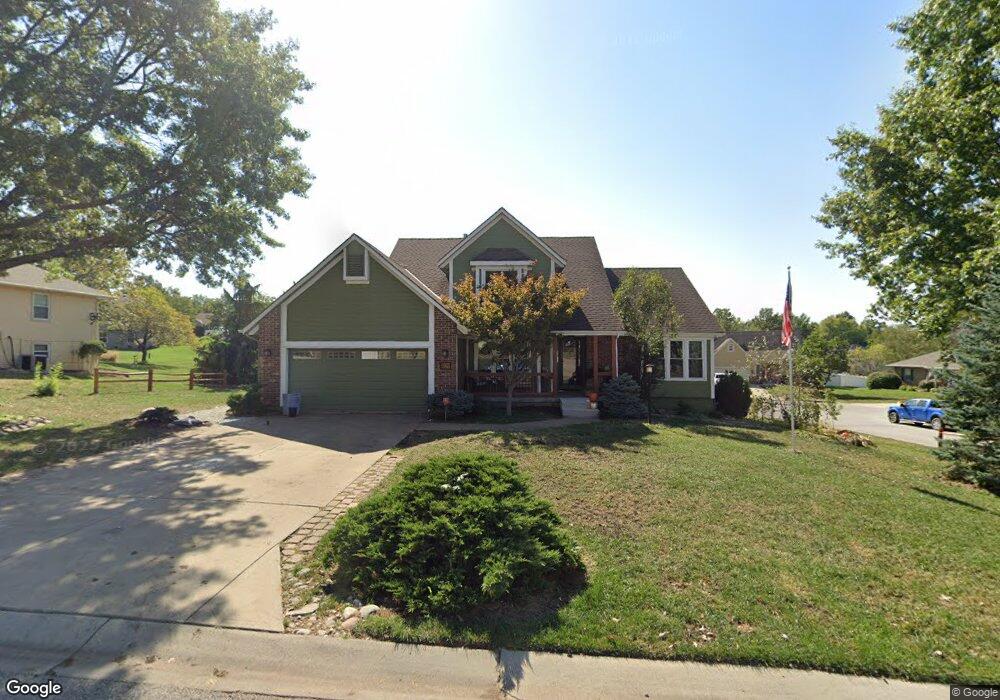
About This Home
This home is located at 609 W Maple St, Raymore, MO 64083 and is currently estimated at $384,410, approximately $142 per square foot. 609 W Maple St is a home located in Cass County with nearby schools including Raymore Elementary School, Raymore-Peculiar East Middle School, and Raymore-Peculiar Senior High School.
Ownership History
We collect this data history from publicly available records. To have your information removed, we recommend requesting removal directly through your county’s website.
Purchase Details
Home Financials for this Owner
Home Financials are based on the most recent Mortgage that was taken out on this home.Home Values in the Area
Average Home Value in this Area
Purchase History
We collect this data history from publicly available records. To have your information removed, we recommend requesting removal directly through your county’s website.
| Date | Buyer | Sale Price | Title Company |
|---|---|---|---|
| -- | -- |
Mortgage History
We collect this data history from publicly available records. To have your information removed, we recommend requesting removal directly through your county’s website.
| Date | Status | Borrower | Loan Amount |
|---|---|---|---|
| Open | $172,000 |
Tax History
We collect this data history from publicly available records. To have your information removed, we recommend requesting removal directly through your county’s website.
| Year | Tax Paid | Tax Assessment Tax Assessment Total Assessment is a certain percentage of the fair market value that is determined by local assessors to be the total taxable value of land and additions on the property. | Land | Improvement |
|---|---|---|---|---|
| 2025 | $3,488 | $48,470 | $5,920 | $42,550 |
| 2024 | $3,488 | $42,860 | $5,380 | $37,480 |
| 2023 | $3,483 | $42,860 | $5,380 | $37,480 |
| 2022 | $3,128 | $38,240 | $5,380 | $32,860 |
| 2021 | $3,129 | $38,240 | $5,380 | $32,860 |
| 2020 | $3,074 | $36,900 | $5,380 | $31,520 |
| 2019 | $2,967 | $36,900 | $5,380 | $31,520 |
| 2018 | $2,758 | $33,120 | $4,600 | $28,520 |
| 2017 | $2,520 | $33,120 | $4,600 | $28,520 |
| 2016 | $2,520 | $31,410 | $4,600 | $26,810 |
| 2015 | $2,522 | $31,410 | $4,600 | $26,810 |
| 2014 | $2,523 | $31,410 | $4,600 | $26,810 |
| 2013 | -- | $31,410 | $4,600 | $26,810 |
Map
- 617 W Maple St
- 115 N Park Dr
- 307 S Sunset Ln
- 203 N Murphy Dr
- 503 S Park Dr
- 205 N Highland Dr
- 200 N Highland Dr
- 417 S Lakeshore Dr
- 500 Bayview Dr
- 300 N Woodson Dr
- 222 N Madison St
- 604 S Sunset Ln
- 615 N Conway St
- 304 N Rice St
- 1103 Brookside Place
- 403 S Silver Top Ln
- 603 Mayberry Ct
- 605 Meadow Ct
- 901 W Lucy Webb Rd
- 213 Pointe Ln
Ask me questions while you tour the home.