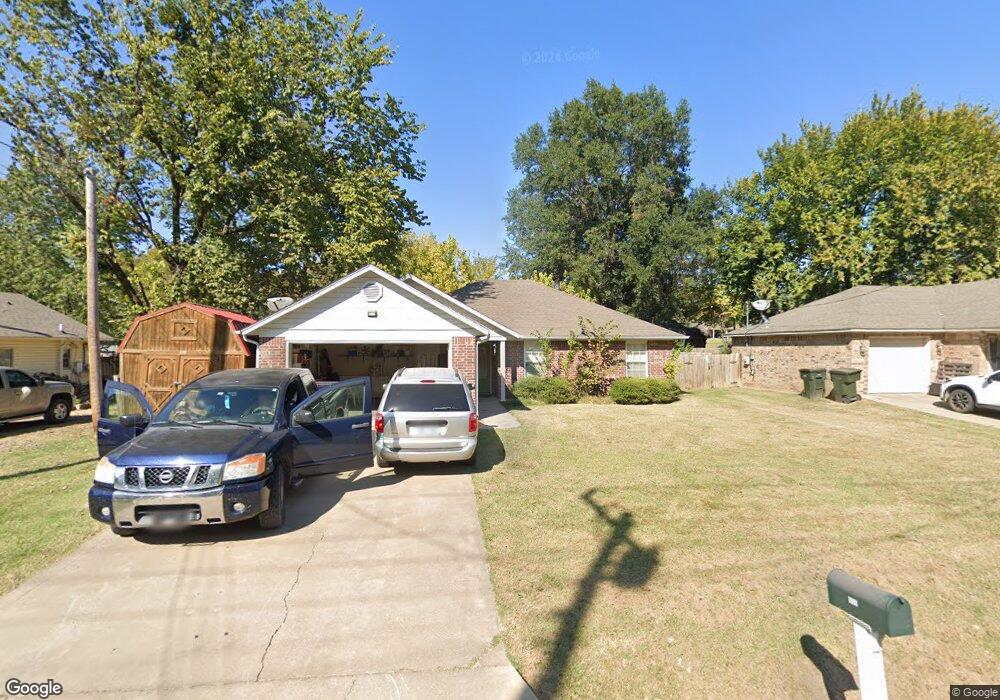
609 W Redwood Ave Sallisaw, OK 74955
Estimated Value: $162,000 - $181,000
--
Bed
--
Bath
981
Sq Ft
$172/Sq Ft
Est. Value
About This Home
This home is located at 609 W Redwood Ave, Sallisaw, OK 74955 and is currently estimated at $169,081, approximately $172 per square foot. 609 W Redwood Ave is a home located in Sequoyah County with nearby schools including Liberty Elementary School, Eastside Elementary School, and Sallisaw Middle School.
Ownership History
Date
Name
Owned For
Owner Type
Purchase Details
Closed on
Apr 4, 2024
Sold by
Barnes Jennie A
Bought by
Carter William R and Carter Lou A
Current Estimated Value
Home Financials for this Owner
Home Financials are based on the most recent Mortgage that was taken out on this home.
Original Mortgage
$174,676
Outstanding Balance
$172,076
Interest Rate
6.9%
Mortgage Type
VA
Estimated Equity
-$2,995
Purchase Details
Closed on
Apr 28, 2022
Sold by
Loewen Ashley and Loewen David
Bought by
Barnes Jennie A
Home Financials for this Owner
Home Financials are based on the most recent Mortgage that was taken out on this home.
Original Mortgage
$144,774
Interest Rate
4.42%
Mortgage Type
New Conventional
Purchase Details
Closed on
Jul 9, 2007
Sold by
Pierce Joel and Pierce Amy
Bought by
Roland Ashley L
Home Financials for this Owner
Home Financials are based on the most recent Mortgage that was taken out on this home.
Original Mortgage
$83,600
Interest Rate
6.37%
Mortgage Type
New Conventional
Create a Home Valuation Report for This Property
The Home Valuation Report is an in-depth analysis detailing your home's value as well as a comparison with similar homes in the area
Home Values in the Area
Average Home Value in this Area
Purchase History
| Date | Buyer | Sale Price | Title Company |
|---|---|---|---|
| Carter William R | $171,000 | Sca Title | |
| Barnes Jennie A | $140,000 | Sca Title | |
| Roland Ashley L | $88,000 | None Available |
Source: Public Records
Mortgage History
| Date | Status | Borrower | Loan Amount |
|---|---|---|---|
| Open | Carter William R | $174,676 | |
| Previous Owner | Barnes Jennie A | $144,774 | |
| Previous Owner | Roland Ashley L | $83,600 |
Source: Public Records
Tax History Compared to Growth
Tax History
| Year | Tax Paid | Tax Assessment Tax Assessment Total Assessment is a certain percentage of the fair market value that is determined by local assessors to be the total taxable value of land and additions on the property. | Land | Improvement |
|---|---|---|---|---|
| 2024 | $1,346 | $14,814 | $1,562 | $13,252 |
| 2023 | $1,346 | $14,109 | $1,562 | $12,547 |
| 2022 | $899 | $10,544 | $1,562 | $8,982 |
| 2021 | $898 | $10,544 | $1,562 | $8,982 |
| 2020 | $914 | $10,544 | $1,562 | $8,982 |
| 2019 | $891 | $10,175 | $990 | $9,185 |
| 2018 | $877 | $9,933 | $990 | $8,943 |
| 2017 | $884 | $10,032 | $990 | $9,042 |
| 2016 | $904 | $10,131 | $990 | $9,141 |
| 2015 | $923 | $10,164 | $924 | $9,240 |
| 2014 | $879 | $9,680 | $1,320 | $8,360 |
Source: Public Records
Map
Nearby Homes
- 605 N Maple St
- 401 N Ash St
- 403 W Argyle Ave
- 403 N Maple St
- 610 N Hickory St
- 310 W Denton Ave
- 404 N Washington St
- 204 W Denton Ave
- 1121 N Maple St
- TBD E 1070 Rd
- 891 W Choctaw Ave
- 428 N Elm St
- 814 W Chickasaw Ave
- 218 W Chickasaw Ave
- 469497 E 975th Rd
- 0 Rural Route Unit 2535327
- 714 W Williams Ave
- 418 S Hickory St
- 402 S Ash St
- 205 W Port Arthur Ave
- 609 W Redwood Ave
- 601 W Redwood Ave
- 611 W Redwood Ave
- 509 N Maple St
- 602 N Ash St
- 520 N Ash St
- 609 N Maple St
- 515 W Redwood Ave
- 618 N Ash St
- 507 N Maple St
- 508 N Maple St
- 603 W Argyle Ave
- 505 N Maple St
- 710 W Redwood Ave
- 500 N Maple St
- 500 N Maple St
- 500 N Maple St
- 511 W Redwood Ave
- 517 W Argyle Ave
- 621 W Denton Ave