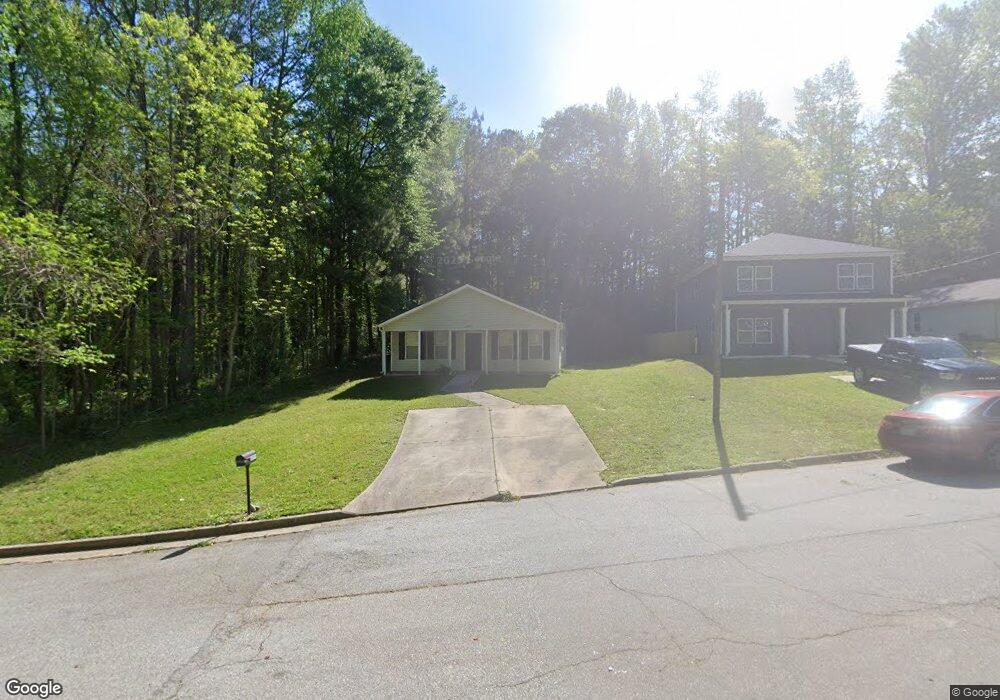
6090 Forrest Ave Union City, GA 30291
Estimated Value: $201,000 - $233,417
4
Beds
2
Baths
1,260
Sq Ft
$173/Sq Ft
Est. Value
About This Home
This home is located at 6090 Forrest Ave, Union City, GA 30291 and is currently estimated at $217,604, approximately $172 per square foot. 6090 Forrest Ave is a home located in Fulton County with nearby schools including Campbell Elementary School, Renaissance Middle School, and Creekside High School.
Ownership History
Date
Name
Owned For
Owner Type
Purchase Details
Closed on
Jul 13, 2022
Sold by
Sims James M
Bought by
Cash4yourhome Llc
Current Estimated Value
Purchase Details
Closed on
Apr 9, 2009
Sold by
Nationstar Mortgage Llc
Bought by
Sims James M
Purchase Details
Closed on
Dec 8, 2008
Sold by
Heartwood 16 Llc
Bought by
Deleon-Ramirez Vania
Purchase Details
Closed on
Apr 1, 2008
Sold by
Deleon-Ramirez Vania
Bought by
Nationstar Mortgage Llc
Purchase Details
Closed on
Oct 2, 2007
Sold by
Isome Michael H
Bought by
Heartwood 16 Llc
Purchase Details
Closed on
May 10, 2006
Sold by
Wickard Bart G and Wickard Charles G
Bought by
Deleon-Ramirez Vania
Home Financials for this Owner
Home Financials are based on the most recent Mortgage that was taken out on this home.
Original Mortgage
$82,000
Interest Rate
8.61%
Mortgage Type
New Conventional
Create a Home Valuation Report for This Property
The Home Valuation Report is an in-depth analysis detailing your home's value as well as a comparison with similar homes in the area
Home Values in the Area
Average Home Value in this Area
Purchase History
| Date | Buyer | Sale Price | Title Company |
|---|---|---|---|
| Cash4yourhome Llc | -- | -- | |
| Baf 3 Llc | -- | -- | |
| Sims James M | $26,300 | -- | |
| Deleon-Ramirez Vania | -- | -- | |
| Nationstar Mortgage Llc | $79,491 | -- | |
| Heartwood 16 Llc | $15,000 | -- | |
| Heartwood 16 Llc | $15,000 | -- | |
| Deleon-Ramirez Vania | $102,500 | -- |
Source: Public Records
Mortgage History
| Date | Status | Borrower | Loan Amount |
|---|---|---|---|
| Previous Owner | Deleon-Ramirez Vania | $82,000 | |
| Previous Owner | Deleon-Ramirez Vania | $3,750 |
Source: Public Records
Tax History Compared to Growth
Tax History
| Year | Tax Paid | Tax Assessment Tax Assessment Total Assessment is a certain percentage of the fair market value that is determined by local assessors to be the total taxable value of land and additions on the property. | Land | Improvement |
|---|---|---|---|---|
| 2025 | $1,061 | $66,240 | $18,320 | $47,920 |
| 2023 | $1,061 | $73,360 | $21,400 | $51,960 |
| 2022 | $1,258 | $47,800 | $13,840 | $33,960 |
| 2021 | $1,450 | $35,960 | $8,600 | $27,360 |
| 2020 | $987 | $35,520 | $8,480 | $27,040 |
| 2019 | $382 | $26,640 | $6,080 | $20,560 |
| 2018 | $593 | $21,000 | $3,320 | $17,680 |
| 2017 | $613 | $21,000 | $3,320 | $17,680 |
| 2016 | $716 | $24,520 | $5,320 | $19,200 |
| 2015 | $1,103 | $24,520 | $5,320 | $19,200 |
| 2014 | $450 | $14,680 | $2,160 | $12,520 |
Source: Public Records
Map
Nearby Homes
- 6200 Ward Rd
- 6211 Ward Rd
- 0 Ward Rd Unit 7174145
- 0 Ward Rd Unit 20102427
- 0 Lakeside Dr Unit 22475152
- 0 Lakeside Dr Unit 7515650
- 0 Simpson Ave Unit 10470974
- 0 Simpson Ave Unit 7532980
- 0 Lower Dixie Lake Rd Unit 22475153
- 0 Lower Dixie Lake Rd Unit 7515143
- 4458 Manor Hill Dr
- 4443 Manor Hill Dr
- 4439 Manor Hill Dr Unit 11
- 5900 Union Woods Way
- 5278 Park Ave
- 6030 Stonewall Dr
- 5910 Rock Rd
- 5545 Union Pointe Place
- Sudbury Plan at Pointe Park
- ROBIE Plan at Pointe Park
- 6110 Forrest Ave
- 6120 Forrest Ave
- 6095 Forrest Ave
- 5320 Lakeside Dr
- 5320 Lakeside Dr Unit 8
- 5510 Lakeside Dr
- 5520 Lakeside Dr
- 5530 Lakeside Dr
- 6105 Forrest Ave Unit 44
- 6105 Forrest Ave
- 6105 Forrest Ave
- 5365 Lakeside Dr
- 6115 Forrest Ave
- 6115 Forrest Ave Unit 45
- 6125 Forrest Ave
- 5544 Lakeside Dr
- 6135 Forrest Ave
- 5552 Lakeside Dr
- 6145 Forrest Ave
- 6146 Forrest Ave