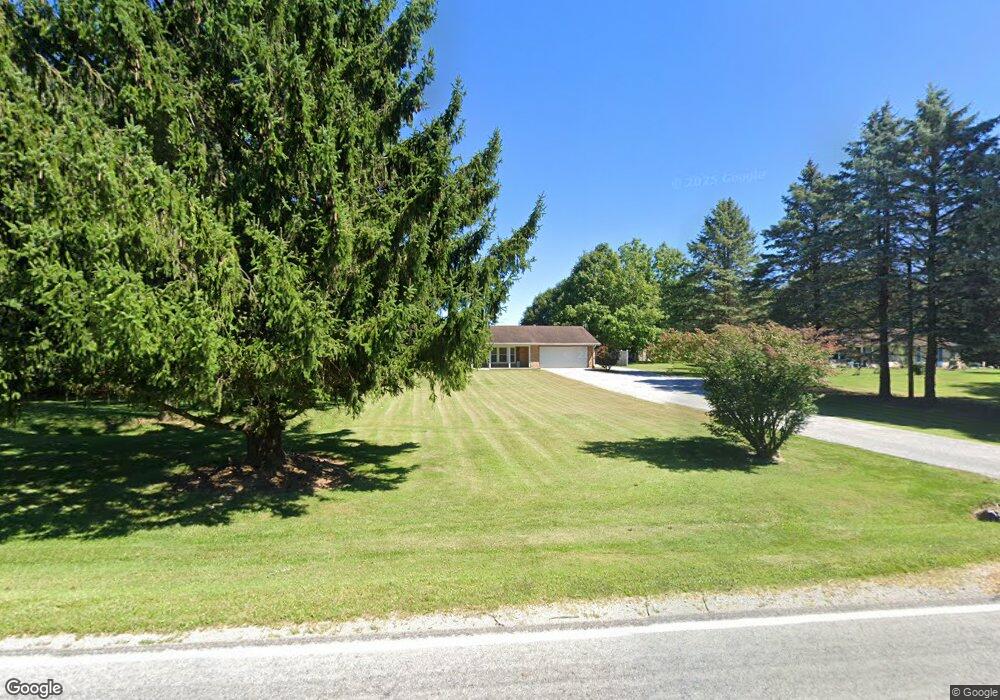
6090 Morris Rd Springfield, OH 45502
Estimated Value: $332,754 - $384,000
4
Beds
2
Baths
2,052
Sq Ft
$177/Sq Ft
Est. Value
About This Home
This home is located at 6090 Morris Rd, Springfield, OH 45502 and is currently estimated at $363,939, approximately $177 per square foot. 6090 Morris Rd is a home located in Clark County with nearby schools including Northridge Elementary School, Kenton Ridge Middle & High School, and Emmanuel Christian Academy.
Ownership History
Date
Name
Owned For
Owner Type
Purchase Details
Closed on
May 26, 2015
Sold by
Taylor Fay E
Bought by
Barch Richard A and Barch Julie A
Current Estimated Value
Home Financials for this Owner
Home Financials are based on the most recent Mortgage that was taken out on this home.
Original Mortgage
$171,000
Interest Rate
3.65%
Mortgage Type
New Conventional
Purchase Details
Closed on
Nov 15, 2005
Sold by
Hess Carol S
Bought by
Taylor Fay E
Home Financials for this Owner
Home Financials are based on the most recent Mortgage that was taken out on this home.
Original Mortgage
$121,600
Interest Rate
6.04%
Mortgage Type
Fannie Mae Freddie Mac
Purchase Details
Closed on
May 28, 1999
Sold by
Brien David D O and Brien Linda D
Bought by
Hess Carol S
Home Financials for this Owner
Home Financials are based on the most recent Mortgage that was taken out on this home.
Original Mortgage
$110,400
Interest Rate
6.92%
Purchase Details
Closed on
Sep 1, 1979
Create a Home Valuation Report for This Property
The Home Valuation Report is an in-depth analysis detailing your home's value as well as a comparison with similar homes in the area
Purchase History
| Date | Buyer | Sale Price | Title Company |
|---|---|---|---|
| Barch Richard A | $180,000 | Attorney | |
| Taylor Fay E | $152,000 | Custom Land Title Llc | |
| Hess Carol S | $138,000 | -- | |
| -- | $54,800 | -- |
Source: Public Records
Mortgage History
| Date | Status | Borrower | Loan Amount |
|---|---|---|---|
| Previous Owner | Barch Richard A | $171,000 | |
| Previous Owner | Taylor Fay E | $121,600 | |
| Previous Owner | Hess Carol S | $110,400 |
Source: Public Records
Tax History
| Year | Tax Paid | Tax Assessment Tax Assessment Total Assessment is a certain percentage of the fair market value that is determined by local assessors to be the total taxable value of land and additions on the property. | Land | Improvement |
|---|---|---|---|---|
| 2025 | $3,384 | $99,090 | $17,790 | $81,300 |
| 2024 | $3,273 | $77,260 | $13,800 | $63,460 |
| 2023 | $5,080 | $77,260 | $13,800 | $63,460 |
| 2022 | $3,285 | $77,260 | $13,800 | $63,460 |
| 2021 | $3,232 | $64,410 | $11,310 | $53,100 |
| 2020 | $3,235 | $64,410 | $11,310 | $53,100 |
| 2019 | $3,297 | $64,410 | $11,310 | $53,100 |
| 2018 | $3,036 | $56,900 | $10,480 | $46,420 |
| 2017 | $2,603 | $56,893 | $10,476 | $46,417 |
| 2016 | $2,536 | $55,808 | $10,476 | $45,332 |
| 2015 | $2,055 | $52,273 | $10,476 | $41,797 |
| 2014 | $2,055 | $52,273 | $10,476 | $41,797 |
| 2013 | $2,007 | $52,273 | $10,476 | $41,797 |
Source: Public Records
Map
Nearby Homes
- 4273 Kay Ave
- 4607 Plateau Dr S
- 1977 Willoughby Ave
- 4954 E County Line Rd
- 4890 Brannan Dr W Unit 4890
- 4500 Bosart Rd
- 1470 Oldham Dr Unit 12
- 1398 Elizabeth Ct Unit 66
- 4732 Lehigh Dr
- 1521 Erika Dr
- 4841 Chippendale Dr
- 4652 Reno Ln Unit 15
- 5235 W Ridgewood Rd
- 4577 Reno Ln Unit 2
- 1309 Richmoor Rd
- 937 Willow Rd
- 3972 Covington Dr Unit 3972
- 4446 Ridgewood Rd E Unit 3
- 4816 Middle Urbana Rd
- 4802 Willowbrook Dr
Your Personal Tour Guide
Ask me questions while you tour the home.