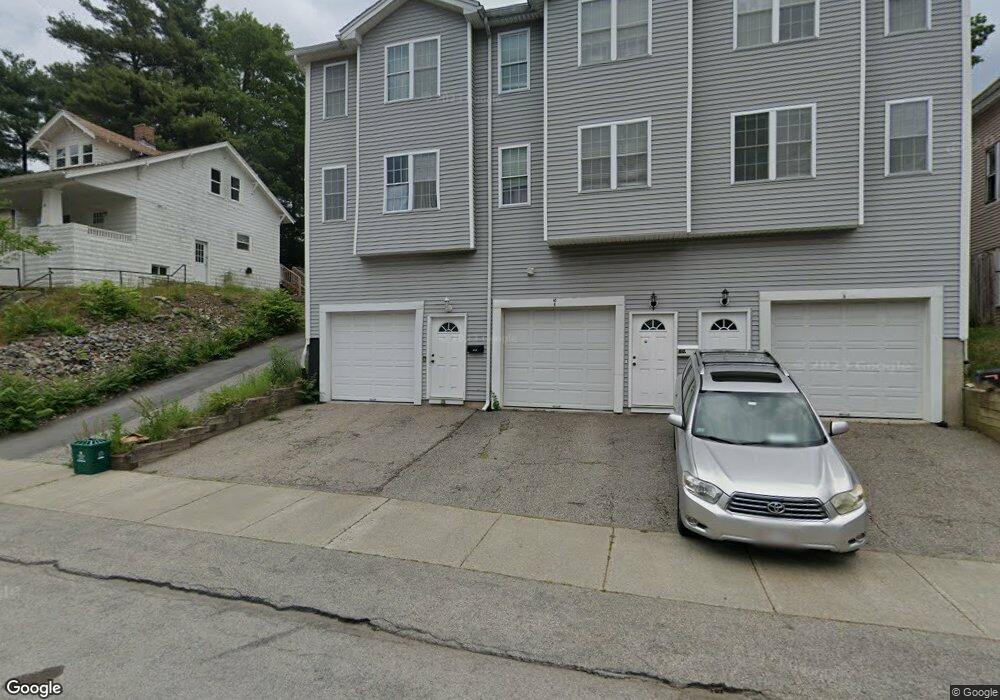
60C Paine St Worcester, MA 01605
Brittan Square NeighborhoodEstimated Value: $411,575 - $459,000
3
Beds
2
Baths
1,536
Sq Ft
$278/Sq Ft
Est. Value
About This Home
This home is located at 60C Paine St, Worcester, MA 01605 and is currently estimated at $426,894, approximately $277 per square foot. 60C Paine St is a home located in Worcester County with nearby schools including City View, Jacob Hiatt Magnet School, and Chandler Magnet.
Ownership History
Date
Name
Owned For
Owner Type
Purchase Details
Closed on
Jun 30, 2009
Sold by
G & K Assoc Inc
Bought by
Jones Emmanuel Eric
Current Estimated Value
Home Financials for this Owner
Home Financials are based on the most recent Mortgage that was taken out on this home.
Original Mortgage
$161,294
Outstanding Balance
$103,165
Interest Rate
4.92%
Mortgage Type
Purchase Money Mortgage
Estimated Equity
$323,729
Purchase Details
Closed on
Sep 27, 2006
Sold by
Farrow Christine and Larson Paul
Bought by
G & K Assoc Inc
Home Financials for this Owner
Home Financials are based on the most recent Mortgage that was taken out on this home.
Original Mortgage
$400,500
Interest Rate
6.52%
Mortgage Type
Purchase Money Mortgage
Create a Home Valuation Report for This Property
The Home Valuation Report is an in-depth analysis detailing your home's value as well as a comparison with similar homes in the area
Home Values in the Area
Average Home Value in this Area
Purchase History
| Date | Buyer | Sale Price | Title Company |
|---|---|---|---|
| Jones Emmanuel Eric | $157,900 | -- | |
| G & K Assoc Inc | $55,000 | -- |
Source: Public Records
Mortgage History
| Date | Status | Borrower | Loan Amount |
|---|---|---|---|
| Open | Jones Emmanuel Eric | $161,294 | |
| Previous Owner | G & K Assoc Inc | $400,500 |
Source: Public Records
Tax History Compared to Growth
Tax History
| Year | Tax Paid | Tax Assessment Tax Assessment Total Assessment is a certain percentage of the fair market value that is determined by local assessors to be the total taxable value of land and additions on the property. | Land | Improvement |
|---|---|---|---|---|
| 2025 | $4,548 | $344,800 | $54,700 | $290,100 |
| 2024 | $4,300 | $312,700 | $54,700 | $258,000 |
| 2023 | $4,143 | $288,900 | $47,600 | $241,300 |
| 2022 | $3,790 | $249,200 | $38,100 | $211,100 |
| 2021 | $3,759 | $230,900 | $30,400 | $200,500 |
| 2020 | $3,667 | $215,700 | $30,200 | $185,500 |
| 2019 | $3,515 | $195,300 | $26,400 | $168,900 |
| 2018 | $3,491 | $184,600 | $26,400 | $158,200 |
| 2017 | $3,269 | $170,100 | $26,400 | $143,700 |
| 2016 | $3,310 | $160,600 | $20,000 | $140,600 |
| 2015 | $3,223 | $160,600 | $20,000 | $140,600 |
| 2014 | $3,138 | $160,600 | $20,000 | $140,600 |
Source: Public Records
Map
Nearby Homes
- 73 Paine St
- 26 Orne St
- 41 Westminster St
- 44 Westminster St
- 139 Lincoln St
- 23 Ashton St
- 19 Mckinley Rd
- 55 Channing St
- 126 Lincoln St
- 2 Henchman St
- 12 Windsor St
- 33 Denmark St
- 24 Catharine St
- 6 Milton St
- 40 Hooper St
- 10 Dryden St Unit 7
- 71 Edgeworth St Unit 21
- 10 Hemans St Unit 9
- 23 Dryden St
- 119 Rodney St