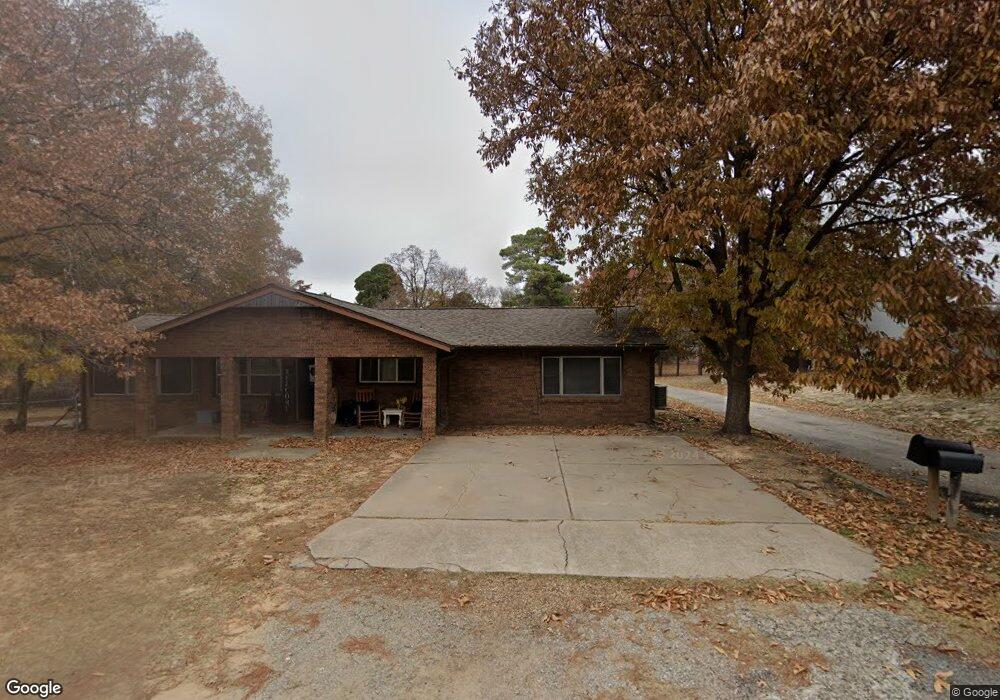
61 2nd St Eufaula, OK 74432
Estimated Value: $223,000 - $302,401
3
Beds
2
Baths
1,860
Sq Ft
$145/Sq Ft
Est. Value
About This Home
This home is located at 61 2nd St, Eufaula, OK 74432 and is currently estimated at $270,350, approximately $145 per square foot. 61 2nd St is a home located in Pittsburg County with nearby schools including Canadian Elementary School and Canadian High School.
Ownership History
Date
Name
Owned For
Owner Type
Purchase Details
Closed on
Jul 11, 2023
Sold by
Lennon Mallie and Lennon Karen J
Bought by
Dobbers Roadhouse Llc
Current Estimated Value
Home Financials for this Owner
Home Financials are based on the most recent Mortgage that was taken out on this home.
Original Mortgage
$200,000
Outstanding Balance
$115,041
Interest Rate
6.79%
Mortgage Type
Credit Line Revolving
Estimated Equity
$155,309
Purchase Details
Closed on
May 10, 2021
Sold by
Romero Kay
Bought by
Hopper Michelle Beth and Hopper Riley
Home Financials for this Owner
Home Financials are based on the most recent Mortgage that was taken out on this home.
Original Mortgage
$163,636
Interest Rate
3.1%
Mortgage Type
New Conventional
Purchase Details
Closed on
Feb 22, 2011
Sold by
Ashmore Billy Jack and Ashmore Patricia
Bought by
Romero Luis and Romero Kay
Purchase Details
Closed on
Jul 28, 1997
Sold by
Jenkins
Bought by
Ashmore
Create a Home Valuation Report for This Property
The Home Valuation Report is an in-depth analysis detailing your home's value as well as a comparison with similar homes in the area
Home Values in the Area
Average Home Value in this Area
Purchase History
| Date | Buyer | Sale Price | Title Company |
|---|---|---|---|
| Dobbers Roadhouse Llc | $250,000 | Sovereign Title Services | |
| Hopper Michelle Beth | $162,000 | None Available | |
| Romero Luis | $90,000 | None Available | |
| Ashmore | $62,500 | -- |
Source: Public Records
Mortgage History
| Date | Status | Borrower | Loan Amount |
|---|---|---|---|
| Open | Dobbers Roadhouse Llc | $200,000 | |
| Previous Owner | Hopper Michelle Beth | $163,636 |
Source: Public Records
Tax History
| Year | Tax Paid | Tax Assessment Tax Assessment Total Assessment is a certain percentage of the fair market value that is determined by local assessors to be the total taxable value of land and additions on the property. | Land | Improvement |
|---|---|---|---|---|
| 2025 | $1,518 | $19,647 | $624 | $19,023 |
| 2024 | $1,518 | $18,711 | $624 | $18,087 |
| 2023 | $1,454 | $17,820 | $624 | $17,196 |
| 2022 | $1,397 | $17,820 | $624 | $17,196 |
| 2021 | $630 | $7,985 | $624 | $7,361 |
| 2020 | $592 | $7,985 | $624 | $7,361 |
| 2019 | $736 | $9,914 | $624 | $9,290 |
| 2018 | $750 | $9,900 | $624 | $9,276 |
| 2017 | $751 | $9,900 | $624 | $9,276 |
| 2016 | $753 | $9,900 | $624 | $9,276 |
| 2015 | $756 | $9,900 | $624 | $9,276 |
| 2014 | -- | $9,900 | $624 | $9,276 |
Source: Public Records
Map
Nearby Homes
- 168 Kiamichi Rd
- 237 Hamilton Rd
- 3 Hamilton Rd
- 4 Hamilton Rd
- 2 Hamilton Rd
- 293 Kiamichi Rd
- 44 Hickory Stick Ln
- 0 Lake Rd
- 15 N Elm St
- 676 N Elm St
- 2 4213 Rd
- 156 Bower Rd
- 8 Bower Rd
- 1437 Nitzel Rd
- 87 Hickory Ln
- 181 Hummingbird Ln
- 0 Hummingbird Ln Unit 2603457
- 9 Bower Rd
- 141 Hickory Ln
- 288 Channel Point
Your Personal Tour Guide
Ask me questions while you tour the home.