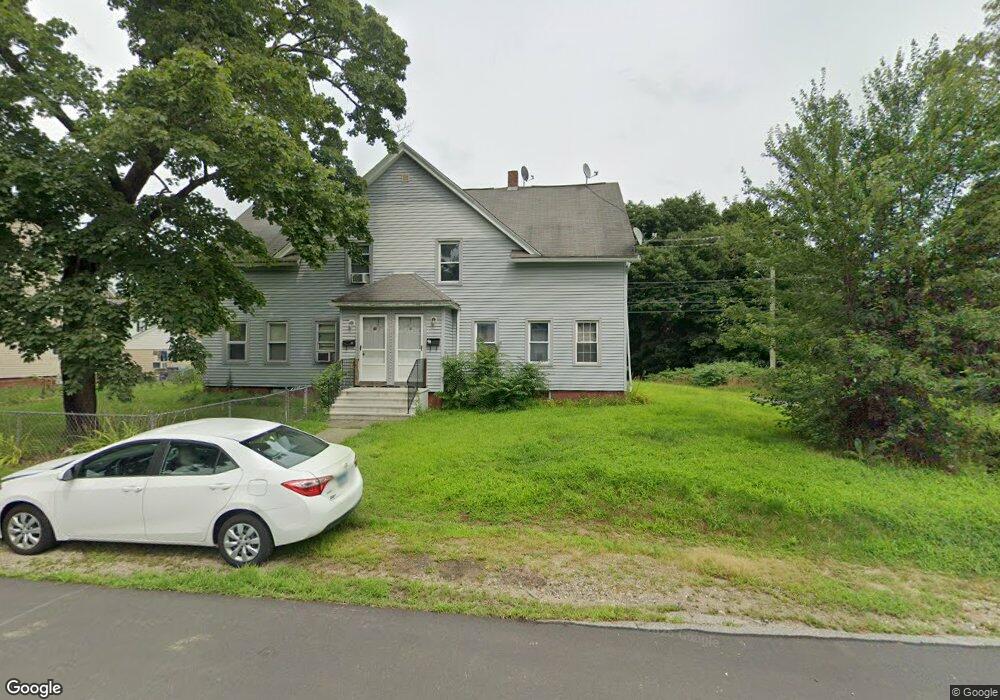
61 2nd St Unit 63 Plainfield, CT 06374
Estimated Value: $310,946 - $390,000
6
Beds
2
Baths
2,619
Sq Ft
$137/Sq Ft
Est. Value
About This Home
This home is located at 61 2nd St Unit 63, Plainfield, CT 06374 and is currently estimated at $357,737, approximately $136 per square foot. 61 2nd St Unit 63 is a home located in Windham County with nearby schools including Plainfield Memorial School, Plainfield Central Middle School, and Plainfield High School.
Ownership History
Date
Name
Owned For
Owner Type
Purchase Details
Closed on
Feb 27, 2013
Sold by
Black Hill 2 Llc
Bought by
Belanger David B
Current Estimated Value
Purchase Details
Closed on
Jul 16, 2009
Sold by
Lasalle Bk
Bought by
Black Hill 2 Llc
Purchase Details
Closed on
Mar 5, 2009
Sold by
Arnold Christopher and Chamberlain Amanda
Bought by
Lasalle Bank Na
Purchase Details
Closed on
Apr 2, 2007
Sold by
Florence Mary E
Bought by
Arnold Christopher and Chamberlain Amanda
Purchase Details
Closed on
Dec 16, 2004
Sold by
Sebastian-Bimler Diane
Bought by
Florence John W and Florence Mary E
Purchase Details
Closed on
Jul 29, 1999
Sold by
Precious Prop Inc
Bought by
Christadore Diane L and Christadore Dominic
Create a Home Valuation Report for This Property
The Home Valuation Report is an in-depth analysis detailing your home's value as well as a comparison with similar homes in the area
Home Values in the Area
Average Home Value in this Area
Purchase History
| Date | Buyer | Sale Price | Title Company |
|---|---|---|---|
| Belanger David B | -- | -- | |
| Belanger David B | -- | -- | |
| Black Hill 2 Llc | $94,000 | -- | |
| Black Hill 2 Llc | $94,000 | -- | |
| Lasalle Bank Na | -- | -- | |
| Lasalle Bank Na | -- | -- | |
| Arnold Christopher | $212,000 | -- | |
| Arnold Christopher | $212,000 | -- | |
| Florence John W | $185,000 | -- | |
| Christadore Diane L | $82,000 | -- | |
| Christadore Diane L | $82,000 | -- |
Source: Public Records
Mortgage History
| Date | Status | Borrower | Loan Amount |
|---|---|---|---|
| Open | Christadore Diane L | $101,250 | |
| Previous Owner | Christadore Diane L | $100,000 |
Source: Public Records
Tax History
| Year | Tax Paid | Tax Assessment Tax Assessment Total Assessment is a certain percentage of the fair market value that is determined by local assessors to be the total taxable value of land and additions on the property. | Land | Improvement |
|---|---|---|---|---|
| 2025 | $3,339 | $143,670 | $25,940 | $117,730 |
| 2024 | $3,208 | $143,670 | $25,940 | $117,730 |
| 2023 | $3,192 | $143,670 | $25,940 | $117,730 |
| 2022 | $4,216 | $101,430 | $23,600 | $77,830 |
| 2021 | $3,056 | $101,430 | $23,600 | $77,830 |
| 2020 | $3,046 | $101,430 | $23,600 | $77,830 |
| 2019 | $3,046 | $101,430 | $23,600 | $77,830 |
| 2018 | $3,008 | $101,430 | $23,600 | $77,830 |
| 2017 | $3,208 | $101,440 | $20,830 | $80,610 |
| 2016 | $3,094 | $101,440 | $20,830 | $80,610 |
| 2015 | $3,024 | $101,440 | $20,830 | $80,610 |
| 2014 | $3,024 | $101,440 | $20,830 | $80,610 |
Source: Public Records
Map
Nearby Homes
- 11 Brookside
- 33 Railroad Ave
- 00 Norwich Rd
- 0A Norwich Rd
- 34 Pleasant St Unit 6
- 34 Pleasant St Unit 4
- 34 Pleasant St Unit 3
- 34 Pleasant St Unit 7
- 34 Pleasant St Unit 8
- 34 Pleasant St Unit 5
- 46 Pleasant St Unit 48
- 0 Pond St Unit 24037041
- 0 Dow Rd Unit 24128109
- 230 Cemetery Rd
- 0 West Pkwy
- 36 Plainfield Pike
- 40 Tarbox Rd
- 83 Kate Downing Rd
- 29 Old Canterbury Rd
- 184 Black Hill Rd
- 61-63 Second St
- 57 2nd St Unit 59
- 57 2nd St
- 58 1st St Unit 60
- 34 2nd St Unit 36
- 58-60 First St
- 30 2nd St Unit 32
- 53 2nd St Unit 55
- 26 2nd St Unit 28
- 54 1st St Unit 56
- 54-56 First St
- 1 Brookside Dr
- 1 Brookside Dr
- 33 3rd St Unit 35
- 29 3rd St Unit 31
- 49 2nd St Unit 51
- 50 1st St Unit 52
- 25 3rd St Unit 27
- 25-27 Third St
- 24 2nd St
Your Personal Tour Guide
Ask me questions while you tour the home.