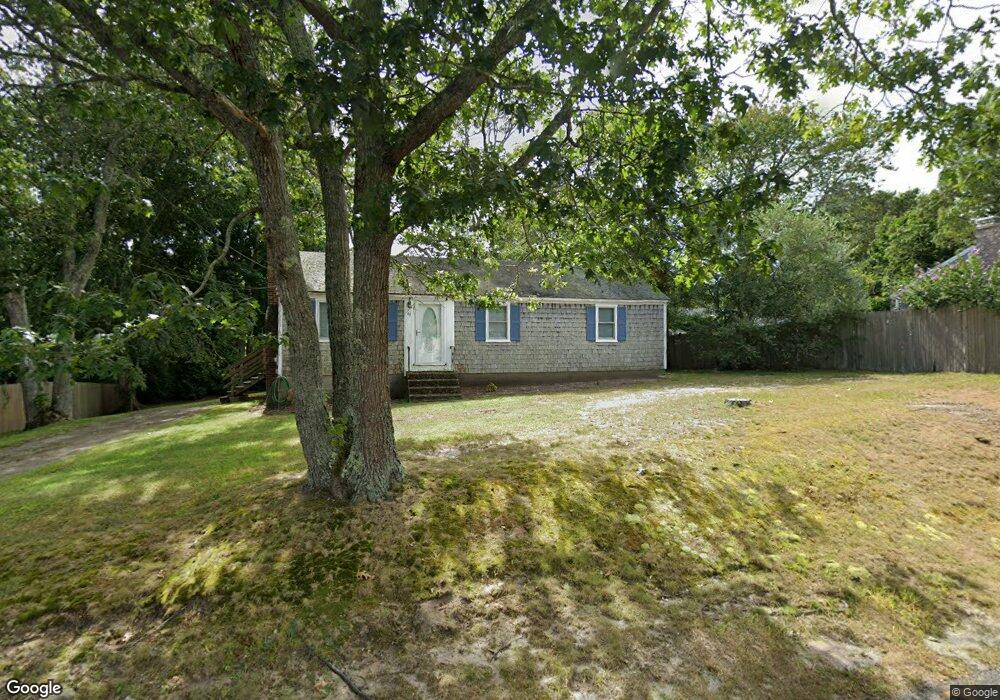
61 Agnes Rd South Dennis, MA 02660
South Dennis NeighborhoodEstimated Value: $471,000 - $526,000
3
Beds
1
Bath
1,001
Sq Ft
$495/Sq Ft
Est. Value
About This Home
This home is located at 61 Agnes Rd, South Dennis, MA 02660 and is currently estimated at $495,881, approximately $495 per square foot. 61 Agnes Rd is a home located in Barnstable County with nearby schools including Dennis-Yarmouth Regional High School and St. Pius X. School.
Ownership History
Date
Name
Owned For
Owner Type
Purchase Details
Closed on
May 24, 2007
Sold by
Bartolomei Mark W
Bought by
Bartolomei Beverly A and Bartolomei Mark W
Current Estimated Value
Purchase Details
Closed on
Apr 1, 2004
Sold by
Thornton Orland D
Bought by
Bartolomei Mark W
Purchase Details
Closed on
Feb 26, 2001
Sold by
Gale James F and Gale Catherine E
Bought by
Thornton Orland D
Home Financials for this Owner
Home Financials are based on the most recent Mortgage that was taken out on this home.
Original Mortgage
$147,900
Interest Rate
6.89%
Mortgage Type
Purchase Money Mortgage
Create a Home Valuation Report for This Property
The Home Valuation Report is an in-depth analysis detailing your home's value as well as a comparison with similar homes in the area
Home Values in the Area
Average Home Value in this Area
Purchase History
| Date | Buyer | Sale Price | Title Company |
|---|---|---|---|
| Bartolomei Beverly A | -- | -- | |
| Bartolomei Mark W | $241,000 | -- | |
| Thornton Orland D | $145,000 | -- |
Source: Public Records
Mortgage History
| Date | Status | Borrower | Loan Amount |
|---|---|---|---|
| Previous Owner | Thornton Orland D | $147,900 | |
| Previous Owner | Thornton Orland D | $58,500 | |
| Previous Owner | Thornton Orland D | $60,000 |
Source: Public Records
Tax History Compared to Growth
Tax History
| Year | Tax Paid | Tax Assessment Tax Assessment Total Assessment is a certain percentage of the fair market value that is determined by local assessors to be the total taxable value of land and additions on the property. | Land | Improvement |
|---|---|---|---|---|
| 2025 | $1,603 | $370,300 | $132,200 | $238,100 |
| 2024 | $1,491 | $339,600 | $127,200 | $212,400 |
| 2023 | $1,442 | $308,700 | $115,600 | $193,100 |
| 2022 | $1,441 | $257,400 | $115,700 | $141,700 |
| 2021 | $1,386 | $229,900 | $113,400 | $116,500 |
| 2020 | $1,336 | $219,000 | $113,400 | $105,600 |
| 2019 | $1,333 | $216,100 | $122,300 | $93,800 |
| 2018 | $1,205 | $190,000 | $105,900 | $84,100 |
| 2017 | $1,152 | $187,300 | $105,900 | $81,400 |
| 2016 | $1,098 | $168,100 | $111,200 | $56,900 |
| 2015 | $1,076 | $168,100 | $111,200 | $56,900 |
| 2014 | $1,137 | $179,000 | $95,300 | $83,700 |
Source: Public Records
Map
Nearby Homes
- 17 Margate Ln
- 153 Bayridge Dr
- 11 Uncle Stanleys Way
- 4 Ebb Rd
- 15 Captain Jud Rd
- 17 Fairmount Rd
- 10 Joanne Dr
- 17 Fairmount Rd
- 7 Vinland Dr
- 25 Skerry Rd
- 118 Driftwood Ln
- 129 Driftwood Ln
- 13 Covey Dr
- 1 Norseman Dr
- 111 Merchant Ave
- 62 Old Fish House Rd
- 6 Hawthorn St
- 4 Old Colony Way
- 32 Captain Walsh Dr
- 6 Nimble Hill Dr