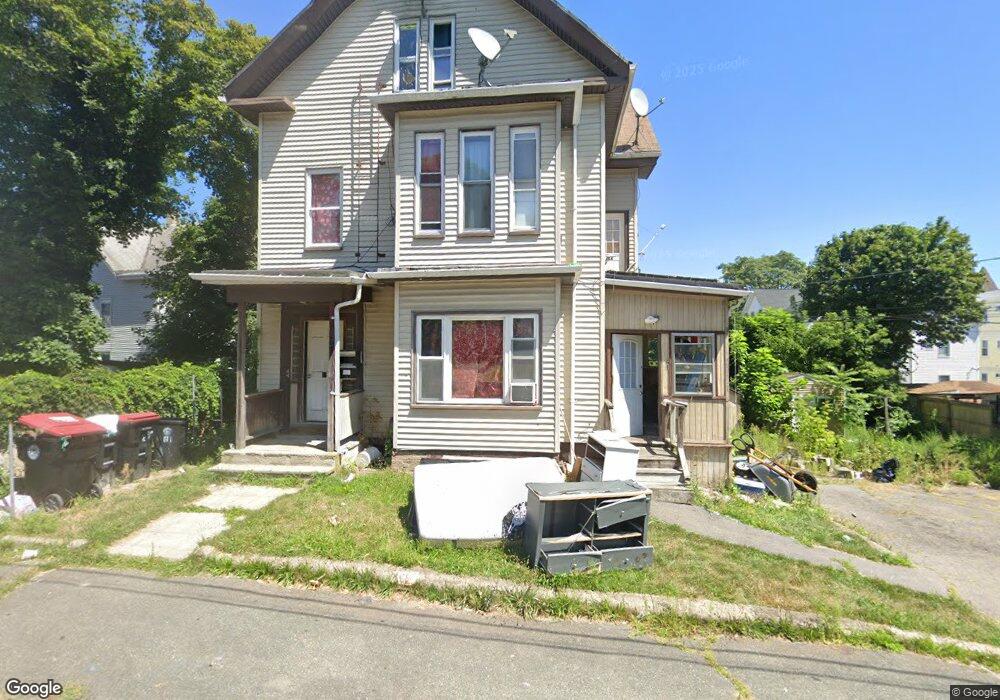
61 Appleton St Brockton, MA 02301
Estimated Value: $765,000 - $857,000
5
Beds
3
Baths
2,766
Sq Ft
$288/Sq Ft
Est. Value
About This Home
This home is located at 61 Appleton St, Brockton, MA 02301 and is currently estimated at $797,000, approximately $288 per square foot. 61 Appleton St is a home located in Plymouth County with nearby schools including Louis F Angelo Elementary School, Manthala George Jr. School, and Raymond K-8 Elementary School.
Ownership History
Date
Name
Owned For
Owner Type
Purchase Details
Closed on
Oct 20, 1995
Sold by
Spagnolo Charles R Est
Bought by
Willett James M and Willett Lisa A
Current Estimated Value
Home Financials for this Owner
Home Financials are based on the most recent Mortgage that was taken out on this home.
Original Mortgage
$32,900
Interest Rate
7.6%
Mortgage Type
Purchase Money Mortgage
Create a Home Valuation Report for This Property
The Home Valuation Report is an in-depth analysis detailing your home's value as well as a comparison with similar homes in the area
Purchase History
| Date | Buyer | Sale Price | Title Company |
|---|---|---|---|
| Willett James M | $47,000 | -- |
Source: Public Records
Mortgage History
| Date | Status | Borrower | Loan Amount |
|---|---|---|---|
| Open | Willett James M | $200,000 | |
| Closed | Willett James M | $150,000 | |
| Closed | Willett James M | $32,900 |
Source: Public Records
Tax History
| Year | Tax Paid | Tax Assessment Tax Assessment Total Assessment is a certain percentage of the fair market value that is determined by local assessors to be the total taxable value of land and additions on the property. | Land | Improvement |
|---|---|---|---|---|
| 2025 | $7,679 | $634,100 | $140,100 | $494,000 |
| 2024 | $7,535 | $626,900 | $140,100 | $486,800 |
| 2023 | $7,675 | $591,300 | $104,500 | $486,800 |
| 2022 | $7,079 | $506,700 | $95,000 | $411,700 |
| 2021 | $6,460 | $445,500 | $78,900 | $366,600 |
| 2020 | $5,636 | $372,000 | $73,900 | $298,100 |
| 2019 | $6,154 | $396,000 | $72,100 | $323,900 |
| 2018 | $4,948 | $308,100 | $72,100 | $236,000 |
| 2017 | $5,065 | $314,600 | $72,100 | $242,500 |
| 2016 | $4,304 | $247,900 | $69,900 | $178,000 |
| 2015 | $3,703 | $204,000 | $69,900 | $134,100 |
| 2014 | $3,608 | $199,000 | $69,900 | $129,100 |
Source: Public Records
Map
Nearby Homes
- 97 Huntington St
- 34 Cherry St
- 39 Huntington St
- 18 Walnut St
- 56 N Warren Ave
- 30 Elliot St
- 90 Cherry St
- 10 Fitzpatrick Ave
- 24 E Ashland St
- 85 Division St
- 7 Main St Unit 203
- 7 Main St Unit 102
- 14 Emmet St
- 527 N Warren Ave
- 45 Cross St
- 48 Simmons Ave
- 16 Olive St
- 146 Court St Unit 108
- 560 N Montello St
- 162 Warren Ave
- 55 Appleton St
- 55 Appleton St Unit 2
- 55 Appleton St Unit 1
- 66 Prospect St
- 100 Turner St
- 74 Prospect St
- 68 Prospect St
- 68 Prospect St Unit 3
- 68 Prospect St Unit 1
- 92 Turner St
- 94 Turner St Unit 3R
- 49 Appleton St
- 64 Prospect St
- 64 Prospect St Unit 2
- 62 Appleton St
- 66 Appleton St
- 88 Turner St
- 58 Appleton St
- 80 Prospect St
- 52 Appleton St
Your Personal Tour Guide
Ask me questions while you tour the home.