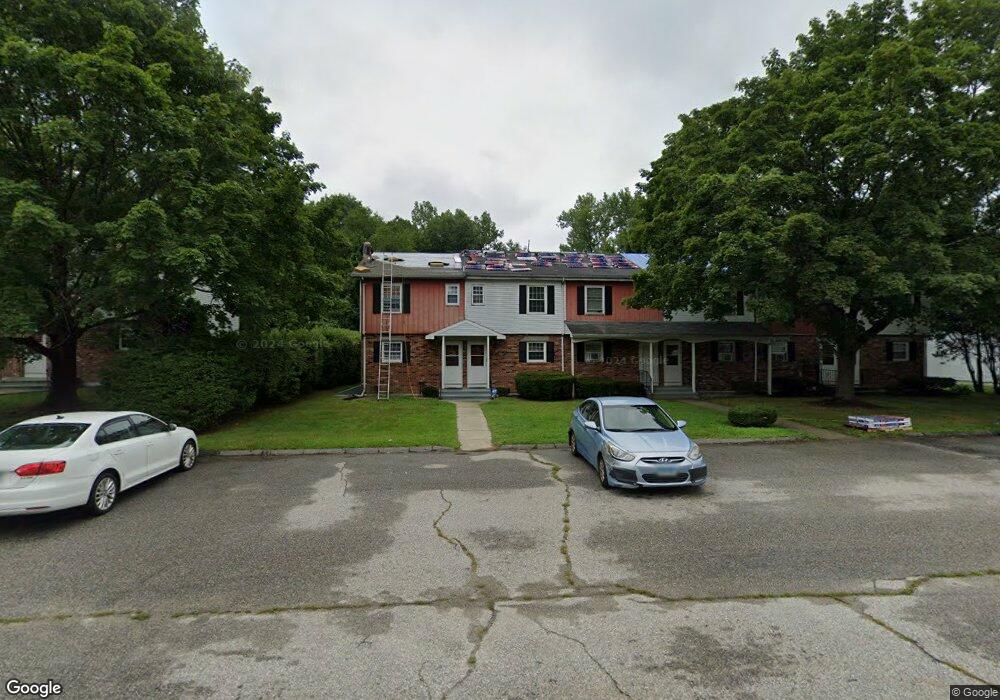
61 Athol St Danielson, CT 06239
Estimated Value: $192,000 - $206,000
2
Beds
2
Baths
896
Sq Ft
$223/Sq Ft
Est. Value
About This Home
This home is located at 61 Athol St, Danielson, CT 06239 and is currently estimated at $199,416, approximately $222 per square foot. 61 Athol St is a home located in Windham County with nearby schools including Killingly Central School, Killingly Memorial School, and Killingly Intermediate School.
Ownership History
Date
Name
Owned For
Owner Type
Purchase Details
Closed on
Apr 10, 2015
Sold by
Zheng Sheng
Bought by
Salisbury George A and Salisbury Dorothy I
Current Estimated Value
Home Financials for this Owner
Home Financials are based on the most recent Mortgage that was taken out on this home.
Original Mortgage
$52,500
Outstanding Balance
$40,460
Interest Rate
3.77%
Mortgage Type
New Conventional
Estimated Equity
$158,956
Purchase Details
Closed on
Feb 20, 1997
Sold by
Cheng Sam Hung
Bought by
Zheng Sheng
Create a Home Valuation Report for This Property
The Home Valuation Report is an in-depth analysis detailing your home's value as well as a comparison with similar homes in the area
Home Values in the Area
Average Home Value in this Area
Purchase History
| Date | Buyer | Sale Price | Title Company |
|---|---|---|---|
| Salisbury George A | $70,000 | -- | |
| Salisbury George A | $70,000 | -- | |
| Zheng Sheng | $45,000 | -- | |
| Zheng Sheng | $45,000 | -- |
Source: Public Records
Mortgage History
| Date | Status | Borrower | Loan Amount |
|---|---|---|---|
| Open | Zheng Sheng | $52,500 | |
| Closed | Zheng Sheng | $52,500 |
Source: Public Records
Tax History Compared to Growth
Tax History
| Year | Tax Paid | Tax Assessment Tax Assessment Total Assessment is a certain percentage of the fair market value that is determined by local assessors to be the total taxable value of land and additions on the property. | Land | Improvement |
|---|---|---|---|---|
| 2025 | $2,632 | $105,080 | $0 | $105,080 |
| 2024 | $2,513 | $105,080 | $0 | $105,080 |
| 2023 | $1,788 | $55,720 | $0 | $55,720 |
| 2022 | $1,682 | $55,720 | $0 | $55,720 |
| 2021 | $1,682 | $55,720 | $0 | $55,720 |
| 2020 | $1,654 | $55,720 | $0 | $55,720 |
| 2019 | $1,672 | $55,720 | $0 | $55,720 |
| 2017 | $1,700 | $52,710 | $0 | $52,710 |
| 2016 | $1,700 | $52,710 | $0 | $52,710 |
| 2015 | $1,666 | $52,710 | $0 | $52,710 |
| 2014 | $1,627 | $52,710 | $0 | $52,710 |
Source: Public Records
Map
Nearby Homes