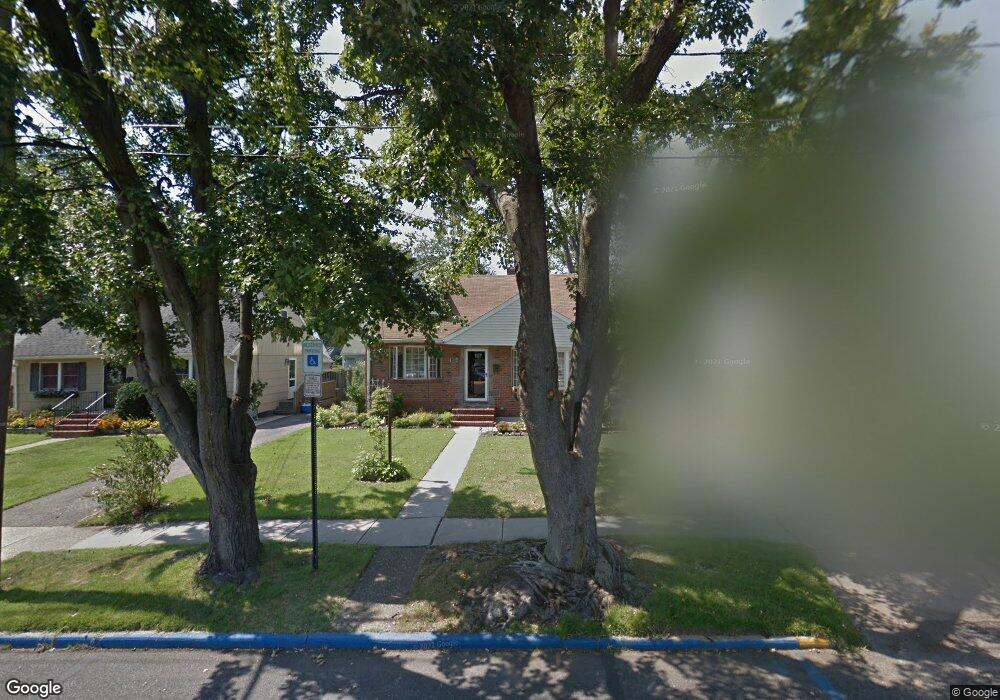
61 Avon Rd Haddonfield, NJ 08033
Estimated Value: $405,000 - $471,000
Studio
--
Bath
1,190
Sq Ft
$367/Sq Ft
Est. Value
About This Home
This home is located at 61 Avon Rd, Haddonfield, NJ 08033 and is currently estimated at $436,856, approximately $367 per square foot. 61 Avon Rd is a home located in Camden County with nearby schools including Avon Elementary School, Woodland Elementary School, and Saint Rose of Lima Catholic School.
Ownership History
Date
Name
Owned For
Owner Type
Purchase Details
Closed on
Apr 10, 2018
Sold by
Layden Karen Z
Bought by
Layden Charles B
Current Estimated Value
Purchase Details
Closed on
Jul 21, 2000
Sold by
Bond John J
Bought by
Layden Charles B and Layden Karen
Home Financials for this Owner
Home Financials are based on the most recent Mortgage that was taken out on this home.
Original Mortgage
$78,500
Outstanding Balance
$27,831
Interest Rate
8.1%
Estimated Equity
$409,025
Create a Home Valuation Report for This Property
The Home Valuation Report is an in-depth analysis detailing your home's value as well as a comparison with similar homes in the area
Home Values in the Area
Average Home Value in this Area
Purchase History
| Date | Buyer | Sale Price | Title Company |
|---|---|---|---|
| Layden Charles B | -- | None Available | |
| Layden Charles B | $122,500 | -- |
Source: Public Records
Mortgage History
| Date | Status | Borrower | Loan Amount |
|---|---|---|---|
| Open | Layden Charles B | $78,500 |
Source: Public Records
Tax History
| Year | Tax Paid | Tax Assessment Tax Assessment Total Assessment is a certain percentage of the fair market value that is determined by local assessors to be the total taxable value of land and additions on the property. | Land | Improvement |
|---|---|---|---|---|
| 2025 | $8,537 | $178,300 | $61,300 | $117,000 |
| 2024 | $8,243 | $178,300 | $61,300 | $117,000 |
| 2023 | $8,243 | $178,300 | $61,300 | $117,000 |
| 2022 | $8,066 | $178,300 | $61,300 | $117,000 |
| 2021 | $7,977 | $178,300 | $61,300 | $117,000 |
| 2020 | $7,845 | $178,300 | $61,300 | $117,000 |
| 2019 | $7,811 | $178,300 | $61,300 | $117,000 |
| 2018 | $7,660 | $178,300 | $61,300 | $117,000 |
| 2017 | $7,469 | $178,300 | $61,300 | $117,000 |
| 2016 | $7,086 | $188,900 | $78,800 | $110,100 |
| 2015 | $6,853 | $188,900 | $78,800 | $110,100 |
| 2014 | $6,564 | $188,900 | $78,800 | $110,100 |
Source: Public Records
Map
Nearby Homes
- 342 Tavistock Blvd
- 425 Peltoma Rd
- 1001 Wayne Rd
- 396 Tavistock Blvd
- 425 White Horse Pike
- 300 Copley Rd
- 302 3rd Ave
- 0 Bell Ave
- 125 Albany Ave
- 139 Treaty Elm Ln
- 370 Station Ave
- 413 Company St
- 237 7th Ave
- 202 Reading Ave
- 104 Treaty Elm Ln
- 320 Company St
- 100 3rd Ave
- 302 Austin Ave
- 103 White Horse Pike
- 95 Lane of Acres
Your Personal Tour Guide
Ask me questions while you tour the home.