Estimated Value: $681,000 - $885,000
3
Beds
2
Baths
1,092
Sq Ft
$718/Sq Ft
Est. Value
About This Home
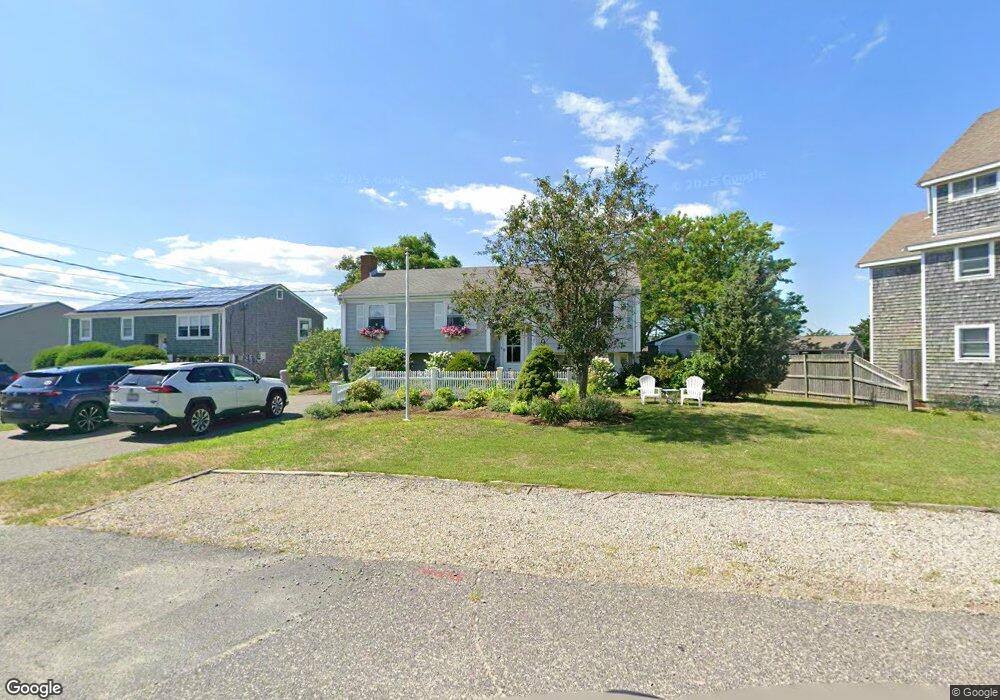
This home is located at 61 Avon St, Marshfield, MA 02050 and is currently estimated at $783,857, approximately $717 per square foot. 61 Avon St is a home located in Plymouth County with nearby schools including Governor Edward Winslow School, Furnace Brook Middle School, and Marshfield High School.
Ownership History
Date
Name
Owned For
Owner Type
Purchase Details
Closed on
Mar 22, 2021
Sold by
Teal Richard C and Teal Catherine S
Bought by
Teal Richard C and Teal Catherine S
Current Estimated Value
Purchase Details
Closed on
Mar 29, 2002
Sold by
Mccauley Kahtleen M
Bought by
Teal Richard C and Mcclellan Catherine S
Purchase Details
Closed on
Oct 30, 1987
Sold by
Darcy Donald J
Bought by
Mccauley Robert L
Create a Home Valuation Report for This Property
The Home Valuation Report is an in-depth analysis detailing your home's value as well as a comparison with similar homes in the area
Home Values in the Area
Average Home Value in this Area
Purchase History
| Date | Buyer | Sale Price | Title Company |
|---|---|---|---|
| Teal Richard C | -- | None Available | |
| Teal Richard C | -- | None Available | |
| Teal Richard C | $330,000 | -- | |
| Teal Richard C | $330,000 | -- | |
| Mccauley Robert L | $186,000 | -- |
Source: Public Records
Mortgage History
| Date | Status | Borrower | Loan Amount |
|---|---|---|---|
| Previous Owner | Mccauley Robert L | $50,000 | |
| Previous Owner | Mccauley Robert L | $123,700 |
Source: Public Records
Tax History Compared to Growth
Tax History
| Year | Tax Paid | Tax Assessment Tax Assessment Total Assessment is a certain percentage of the fair market value that is determined by local assessors to be the total taxable value of land and additions on the property. | Land | Improvement |
|---|---|---|---|---|
| 2025 | $6,362 | $642,600 | $382,700 | $259,900 |
| 2024 | $6,230 | $599,600 | $362,500 | $237,100 |
| 2023 | $5,395 | $519,700 | $314,200 | $205,500 |
| 2022 | $5,395 | $416,600 | $251,800 | $164,800 |
| 2021 | $5,338 | $404,700 | $251,800 | $152,900 |
| 2020 | $5,355 | $401,700 | $251,800 | $149,900 |
| 2019 | $5,276 | $394,300 | $251,800 | $142,500 |
| 2018 | $4,633 | $346,500 | $211,500 | $135,000 |
| 2017 | $4,552 | $331,800 | $211,500 | $120,300 |
| 2016 | $4,542 | $327,200 | $211,500 | $115,700 |
| 2015 | $4,214 | $317,100 | $201,400 | $115,700 |
| 2014 | $4,161 | $313,100 | $211,500 | $101,600 |
Source: Public Records
Map
Nearby Homes
- 71 Gurnet Rd
- 184 Bay Ave Unit 2
- 70 Beach St
- 76 Marginal St
- 106 Careswell St
- 36 Ocean Rd N
- 57 Island St
- 64 Danforth St
- 53 Ocean St
- 16 Red Pony Path Unit 16
- 5 Adelaide Way
- 78 Tower Ave
- 335 Ocean St
- 328 Ocean St
- 90 Presidential Cir
- 176 Plymouth Ave
- 7 Everson Rd
- 74 Abrams Hill Rd
- 236 Powder Point Ave
- 39 Bay Pond Rd