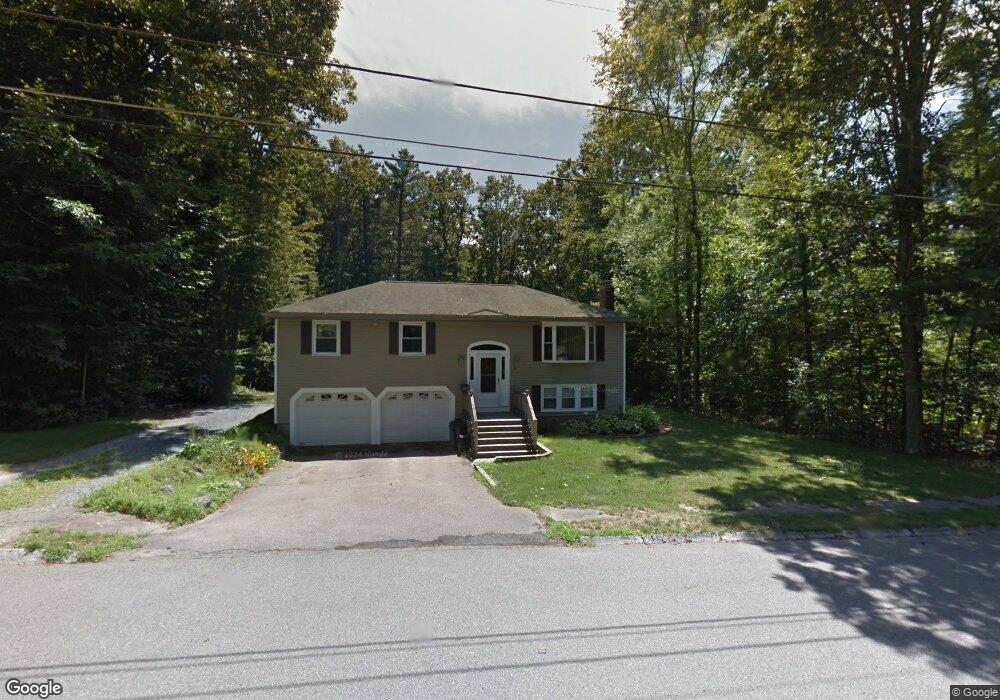
61 Borrows Rd Foxboro, MA 02035
Estimated Value: $556,000 - $698,000
3
Beds
3
Baths
1,080
Sq Ft
$581/Sq Ft
Est. Value
About This Home
This home is located at 61 Borrows Rd, Foxboro, MA 02035 and is currently estimated at $626,958, approximately $580 per square foot. 61 Borrows Rd is a home located in Norfolk County with nearby schools including Foxborough High School, Discovery Daycare Center, and Hands-On-Montessori School.
Ownership History
Date
Name
Owned For
Owner Type
Purchase Details
Closed on
Feb 19, 1999
Sold by
Wright Richard M
Bought by
Preston Jess M and Preston Stephanie H
Current Estimated Value
Home Financials for this Owner
Home Financials are based on the most recent Mortgage that was taken out on this home.
Original Mortgage
$117,000
Interest Rate
6.75%
Mortgage Type
Purchase Money Mortgage
Create a Home Valuation Report for This Property
The Home Valuation Report is an in-depth analysis detailing your home's value as well as a comparison with similar homes in the area
Home Values in the Area
Average Home Value in this Area
Purchase History
| Date | Buyer | Sale Price | Title Company |
|---|---|---|---|
| Preston Jess M | $130,000 | -- |
Source: Public Records
Mortgage History
| Date | Status | Borrower | Loan Amount |
|---|---|---|---|
| Open | Preston Jess M | $92,000 | |
| Closed | Preston Jess M | $117,000 |
Source: Public Records
Tax History
| Year | Tax Paid | Tax Assessment Tax Assessment Total Assessment is a certain percentage of the fair market value that is determined by local assessors to be the total taxable value of land and additions on the property. | Land | Improvement |
|---|---|---|---|---|
| 2025 | $6,860 | $518,900 | $241,200 | $277,700 |
| 2024 | $6,771 | $501,200 | $245,600 | $255,600 |
| 2023 | $6,581 | $463,100 | $233,900 | $229,200 |
| 2022 | $5,965 | $410,800 | $196,100 | $214,700 |
| 2021 | $5,575 | $378,200 | $181,600 | $196,600 |
| 2020 | $5,203 | $357,100 | $181,600 | $175,500 |
| 2019 | $5,136 | $349,400 | $172,900 | $176,500 |
| 2018 | $5,002 | $343,300 | $172,900 | $170,400 |
| 2017 | $4,876 | $324,200 | $161,600 | $162,600 |
| 2016 | $4,940 | $333,300 | $162,900 | $170,400 |
| 2015 | $4,849 | $319,200 | $137,700 | $181,500 |
| 2014 | $4,650 | $310,200 | $128,700 | $181,500 |
Source: Public Records
Map
Nearby Homes
- 128 Tremont St
- 1769 West St
- 346 South St
- 24 Maverick Dr
- 40 Treasure Island Rd
- 16 Treasure Island Rd
- 85 Jewell St
- 33 Colonial Way
- 9 Coach Rd
- 46 Mirimichi St
- 84 Messenger St
- 356 Central St
- 155 South St
- 166 Chauncy St
- 150 Gilbert St
- 14 Claire Ave
- 25 Munroe Dr
- 233 Central St
- 150 Rumford Ave Unit 110
- 157 Central St
Your Personal Tour Guide
Ask me questions while you tour the home.