61 Chapman St Dracut, MA 01826
Estimated Value: $607,844 - $663,000
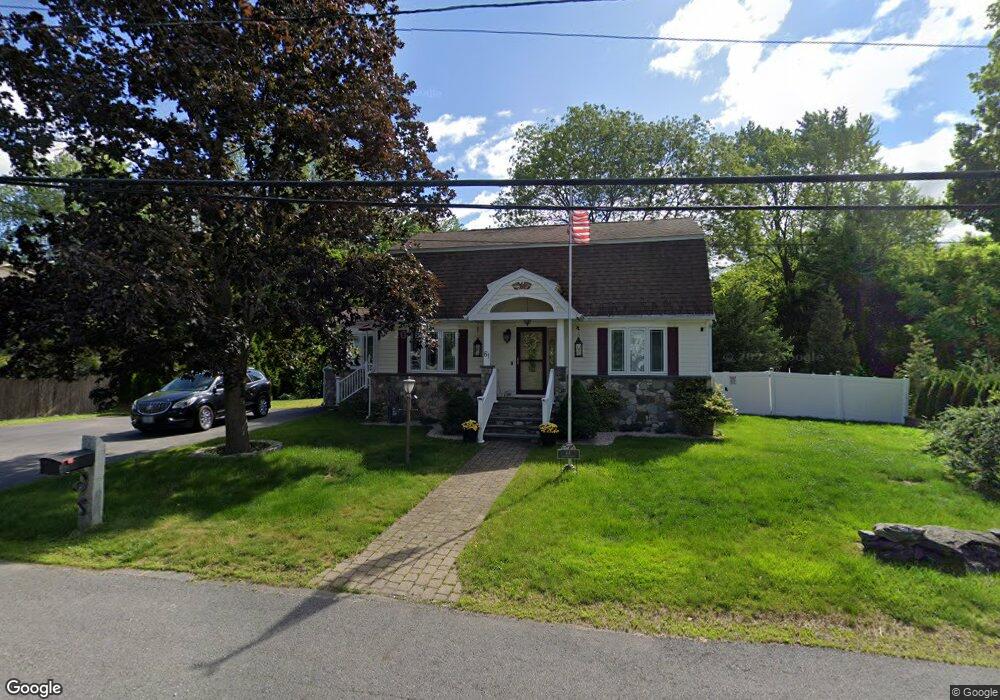
About This Home
This home is located at 61 Chapman St, Dracut, MA 01826 and is currently estimated at $633,711, approximately $352 per square foot. 61 Chapman St is a home located in Middlesex County with nearby schools including Greenmont Avenue School, Richardson Middle School, and Dracut Senior High School.
Ownership History
We collect this data history from publicly available records. To have your information removed, we recommend requesting removal directly through your county’s website.
Purchase Details
Purchase Details
Home Financials for this Owner
Home Financials are based on the most recent Mortgage that was taken out on this home.Purchase Details
Home Values in the Area
Average Home Value in this Area
Purchase History
We collect this data history from publicly available records. To have your information removed, we recommend requesting removal directly through your county’s website.
| Date | Buyer | Sale Price | Title Company |
|---|---|---|---|
| -- | -- | ||
| -- | -- | ||
| -- | -- |
Mortgage History
We collect this data history from publicly available records. To have your information removed, we recommend requesting removal directly through your county’s website.
| Date | Status | Borrower | Loan Amount |
|---|---|---|---|
| Previous Owner | $168,000 |
Tax History
We collect this data history from publicly available records. To have your information removed, we recommend requesting removal directly through your county’s website.
| Year | Tax Paid | Tax Assessment Tax Assessment Total Assessment is a certain percentage of the fair market value that is determined by local assessors to be the total taxable value of land and additions on the property. | Land | Improvement |
|---|---|---|---|---|
| 2025 | $5,636 | $556,900 | $216,500 | $340,400 |
| 2024 | $5,441 | $520,700 | $206,100 | $314,600 |
| 2023 | $5,283 | $456,200 | $179,200 | $277,000 |
| 2022 | $5,148 | $418,900 | $162,800 | $256,100 |
| 2021 | $4,979 | $382,700 | $148,000 | $234,700 |
| 2020 | $4,829 | $361,700 | $143,500 | $218,200 |
| 2019 | $4,430 | $322,200 | $136,700 | $185,500 |
| 2018 | $4,535 | $320,700 | $136,700 | $184,000 |
| 2017 | $4,502 | $320,700 | $136,700 | $184,000 |
| 2016 | $4,376 | $294,900 | $131,400 | $163,500 |
| 2015 | $4,224 | $282,900 | $131,400 | $151,500 |
| 2014 | $3,950 | $272,600 | $131,400 | $141,200 |
Map
- 1544 Bridge St
- 1315 Bridge St
- 112 Genest St Unit 9
- 112 Genest St Unit 7
- 551 Hildreth St Unit 21
- 551 Hildreth St Unit 27
- 50 Frank St Unit 50
- 365 Aiken Ave Unit 11
- 367 Aiken Ave Unit 8
- 10 Lanseigne St
- 51 Willard St
- 417 Hildreth St Unit 6
- 417 Hildreth St Unit 12
- 246 Aiken Ave Unit 7
- 58 Leo Ave
- 160 Orleans St
- 185 18th St
- 23 18th St
- 15 Wildwood St Unit B19
- 18 Sutherland St
Ask me questions while you tour the home.