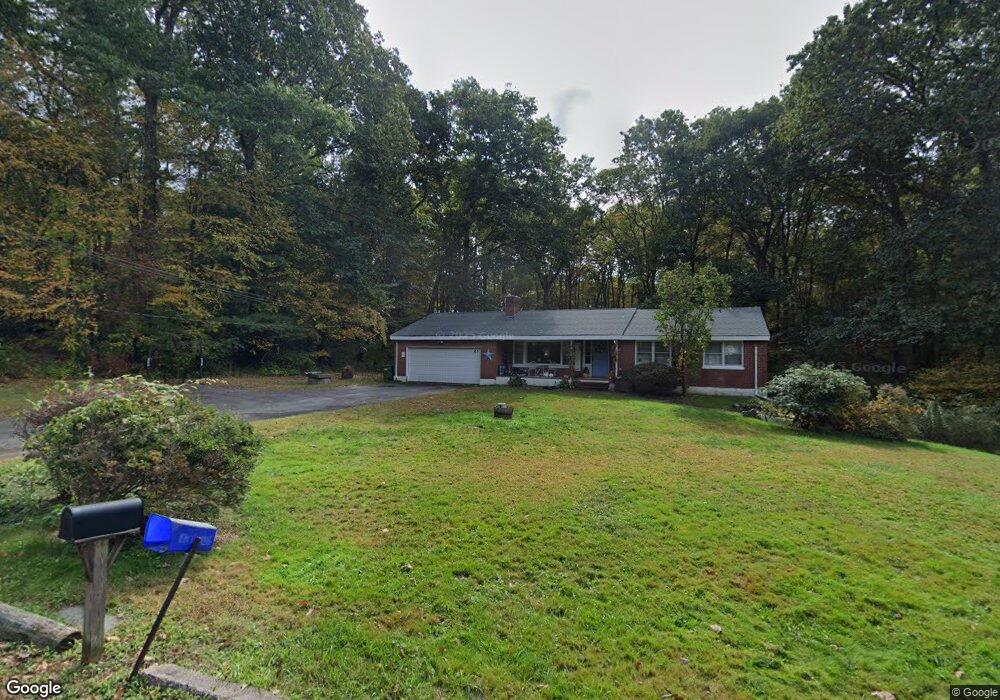
61 Childs Rd East Hampton, CT 06424
Estimated Value: $346,000 - $384,000
3
Beds
1
Bath
1,496
Sq Ft
$241/Sq Ft
Est. Value
About This Home
This home is located at 61 Childs Rd, East Hampton, CT 06424 and is currently estimated at $359,938, approximately $240 per square foot. 61 Childs Rd is a home located in Middlesex County with nearby schools including Memorial School, Center Elementary School, and East Hampton Middle School.
Ownership History
Date
Name
Owned For
Owner Type
Purchase Details
Closed on
Aug 1, 2013
Sold by
Dunham Douglas and Dunham Elizabeth E
Bought by
Varni David and Varni Tina
Current Estimated Value
Home Financials for this Owner
Home Financials are based on the most recent Mortgage that was taken out on this home.
Original Mortgage
$137,464
Interest Rate
3.95%
Mortgage Type
New Conventional
Purchase Details
Closed on
Nov 9, 2006
Sold by
Boyce Mary Jane
Bought by
Dunham Douglas and Dunham Elizabeth E
Home Financials for this Owner
Home Financials are based on the most recent Mortgage that was taken out on this home.
Original Mortgage
$120,000
Interest Rate
6.31%
Create a Home Valuation Report for This Property
The Home Valuation Report is an in-depth analysis detailing your home's value as well as a comparison with similar homes in the area
Home Values in the Area
Average Home Value in this Area
Purchase History
| Date | Buyer | Sale Price | Title Company |
|---|---|---|---|
| Varni David | -- | -- | |
| Varni David | -- | -- | |
| Dunham Douglas | $150,000 | -- | |
| Dunham Douglas | $150,000 | -- |
Source: Public Records
Mortgage History
| Date | Status | Borrower | Loan Amount |
|---|---|---|---|
| Open | Dunham Douglas | $159,137 | |
| Closed | Dunham Douglas | $137,464 | |
| Previous Owner | Dunham Douglas | $114,874 | |
| Previous Owner | Dunham Douglas | $120,000 |
Source: Public Records
Tax History Compared to Growth
Tax History
| Year | Tax Paid | Tax Assessment Tax Assessment Total Assessment is a certain percentage of the fair market value that is determined by local assessors to be the total taxable value of land and additions on the property. | Land | Improvement |
|---|---|---|---|---|
| 2025 | $6,018 | $151,540 | $56,810 | $94,730 |
| 2024 | $5,765 | $151,540 | $56,810 | $94,730 |
| 2023 | $5,465 | $151,540 | $56,810 | $94,730 |
| 2022 | $5,252 | $151,540 | $56,810 | $94,730 |
| 2021 | $5,233 | $151,540 | $56,810 | $94,730 |
| 2020 | $5,175 | $156,150 | $57,900 | $98,250 |
| 2019 | $5,182 | $156,360 | $59,520 | $96,840 |
| 2018 | $4,897 | $156,360 | $59,520 | $96,840 |
| 2017 | $4,897 | $156,360 | $59,520 | $96,840 |
| 2016 | $4,603 | $156,360 | $59,520 | $96,840 |
| 2015 | $4,009 | $144,330 | $57,960 | $86,370 |
| 2014 | $3,488 | $144,330 | $57,960 | $86,370 |
Source: Public Records
Map
Nearby Homes