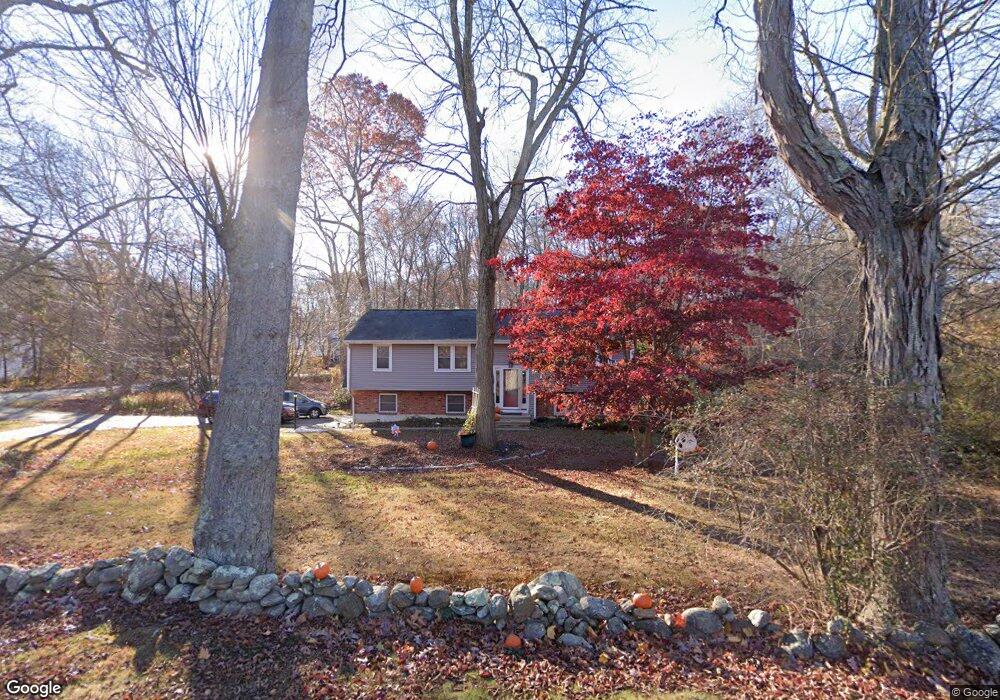
61 Dean Rd East Lyme, CT 06333
Estimated Value: $428,000 - $497,000
3
Beds
2
Baths
1,196
Sq Ft
$383/Sq Ft
Est. Value
About This Home
This home is located at 61 Dean Rd, East Lyme, CT 06333 and is currently estimated at $458,368, approximately $383 per square foot. 61 Dean Rd is a home located in New London County with nearby schools including East Lyme Middle School and East Lyme High School.
Ownership History
Date
Name
Owned For
Owner Type
Purchase Details
Closed on
Jan 11, 2023
Sold by
Matlock James D
Bought by
Matlock Kimberly
Current Estimated Value
Purchase Details
Closed on
Jul 21, 2000
Sold by
Dugan Michael S and Dugan Lynne M
Bought by
Johnson Kimberly and Matlock James D
Purchase Details
Closed on
Nov 24, 1998
Sold by
Healy Nancy Jean
Bought by
Dugan Michael S and Dugan Lynne M
Create a Home Valuation Report for This Property
The Home Valuation Report is an in-depth analysis detailing your home's value as well as a comparison with similar homes in the area
Home Values in the Area
Average Home Value in this Area
Purchase History
| Date | Buyer | Sale Price | Title Company |
|---|---|---|---|
| Matlock Kimberly | -- | None Available | |
| Johnson Kimberly | $175,000 | -- | |
| Dugan Michael S | $135,900 | -- |
Source: Public Records
Mortgage History
| Date | Status | Borrower | Loan Amount |
|---|---|---|---|
| Previous Owner | Dugan Michael S | $157,500 | |
| Previous Owner | Dugan Michael S | $45,000 | |
| Previous Owner | Dugan Michael S | $186,000 | |
| Previous Owner | Dugan Michael S | $168,000 |
Source: Public Records
Tax History Compared to Growth
Tax History
| Year | Tax Paid | Tax Assessment Tax Assessment Total Assessment is a certain percentage of the fair market value that is determined by local assessors to be the total taxable value of land and additions on the property. | Land | Improvement |
|---|---|---|---|---|
| 2025 | $6,027 | $215,180 | $97,930 | $117,250 |
| 2024 | $5,670 | $215,180 | $97,930 | $117,250 |
| 2023 | $5,354 | $215,180 | $97,930 | $117,250 |
| 2022 | $5,130 | $215,180 | $97,930 | $117,250 |
| 2021 | $4,969 | $174,300 | $93,030 | $81,270 |
| 2020 | $4,862 | $171,430 | $93,030 | $78,400 |
| 2019 | $4,833 | $171,430 | $93,030 | $78,400 |
| 2018 | $4,292 | $156,940 | $93,030 | $63,910 |
| 2017 | $4,428 | $169,260 | $93,030 | $76,230 |
| 2016 | $4,221 | $166,460 | $88,130 | $78,330 |
| 2015 | $4,113 | $166,460 | $88,130 | $78,330 |
| 2014 | $4,000 | $166,460 | $88,130 | $78,330 |
Source: Public Records
Map
Nearby Homes
- 13 Willow Ln
- 25 Marion Dr
- 28 Alexander Dr
- 6 Marion Dr
- 223 N Bride Brook Rd
- 270 N Bride Brook Rd
- 420 Boston Post Rd
- 72 Society Rd
- 20 Sunrise Trail
- 496 Boston Post Rd
- 5 Pumpkin Grove
- 11 Pumpkin Grove
- 14 Pumpkin Grove
- 33 Arbor Crossing
- 91 Riverview Rd Unit 7B
- 156 Flanders Rd
- 57 Spring Rock Rd
- 16 Cubles Dr
- 231 Boston Post Rd Unit 9
- Waramaug Plan at Riverside Reserve