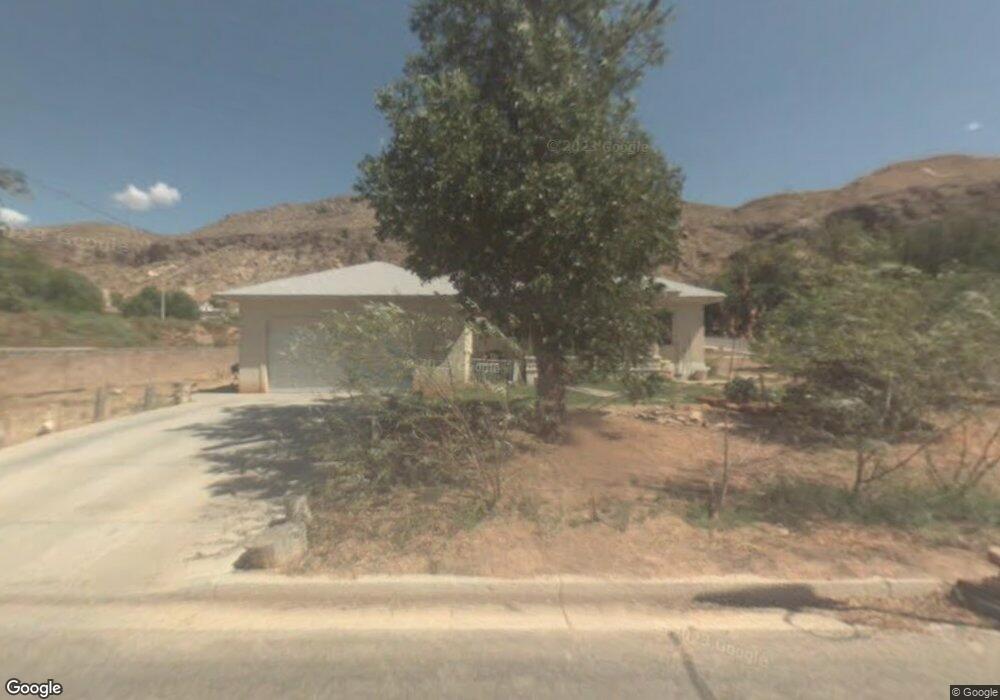
61 E 130 N La Verkin, UT 84745
Estimated Value: $483,000 - $551,000
4
Beds
3
Baths
3,000
Sq Ft
$170/Sq Ft
Est. Value
About This Home
This home is located at 61 E 130 N, La Verkin, UT 84745 and is currently estimated at $508,766, approximately $169 per square foot. 61 E 130 N is a home located in Washington County with nearby schools including La Verkin Elementary School, Hurricane Middle School, and Hurricane High School.
Ownership History
Date
Name
Owned For
Owner Type
Purchase Details
Closed on
Jul 15, 2019
Sold by
Miller Lori and Miller Aaron
Bought by
Black Brian J and Black Sara
Current Estimated Value
Home Financials for this Owner
Home Financials are based on the most recent Mortgage that was taken out on this home.
Original Mortgage
$262,200
Outstanding Balance
$230,087
Interest Rate
3.9%
Mortgage Type
New Conventional
Estimated Equity
$278,679
Purchase Details
Closed on
Jan 11, 2006
Sold by
Eiwell Jack
Bought by
Freedom Circle Llc
Create a Home Valuation Report for This Property
The Home Valuation Report is an in-depth analysis detailing your home's value as well as a comparison with similar homes in the area
Home Values in the Area
Average Home Value in this Area
Purchase History
| Date | Buyer | Sale Price | Title Company |
|---|---|---|---|
| Black Brian J | -- | Infinity Title Ins Agcy Llc | |
| Freedom Circle Llc | -- | None Available |
Source: Public Records
Mortgage History
| Date | Status | Borrower | Loan Amount |
|---|---|---|---|
| Open | Black Brian J | $262,200 |
Source: Public Records
Tax History
| Year | Tax Paid | Tax Assessment Tax Assessment Total Assessment is a certain percentage of the fair market value that is determined by local assessors to be the total taxable value of land and additions on the property. | Land | Improvement |
|---|---|---|---|---|
| 2025 | $2,169 | $288,585 | $59,400 | $229,185 |
| 2023 | $2,065 | $273,790 | $59,400 | $214,390 |
| 2022 | $2,202 | $274,780 | $39,600 | $235,180 |
| 2021 | $1,982 | $364,200 | $54,000 | $310,200 |
| 2020 | $3,274 | $309,300 | $54,000 | $255,300 |
| 2019 | $1,533 | $252,400 | $35,000 | $217,400 |
| 2018 | $1,429 | $115,885 | $0 | $0 |
| 2017 | $1,382 | $112,090 | $0 | $0 |
| 2016 | $1,324 | $103,070 | $0 | $0 |
| 2015 | $1,759 | $131,600 | $0 | $0 |
| 2014 | $1,577 | $116,400 | $0 | $0 |
Source: Public Records
Map
Nearby Homes
- 728 N 15 W
- 0 Lot #1 Valle Vista Unit 25-262463
- 161 E 130 N
- 25 E 200 N
- 0 Lot #2 Valle Vista Unit 25-262464
- 0 Lot #4 Valle Vista Unit 25-262467
- 0 Vista Unit 25-262466
- 235 N 200 E
- 235 N 200 E Unit 55
- 200 N State St
- 80 W Center St Unit 13
- 65 S Main St
- 385 N 100 E
- 233 N State St
- 353 N 200 E Unit 40
- 353 N 200 E
- 384 N 200 E
- 403 N 200 E
- 403 N 200 E Unit 1
- 39 W 380 N
Your Personal Tour Guide
Ask me questions while you tour the home.