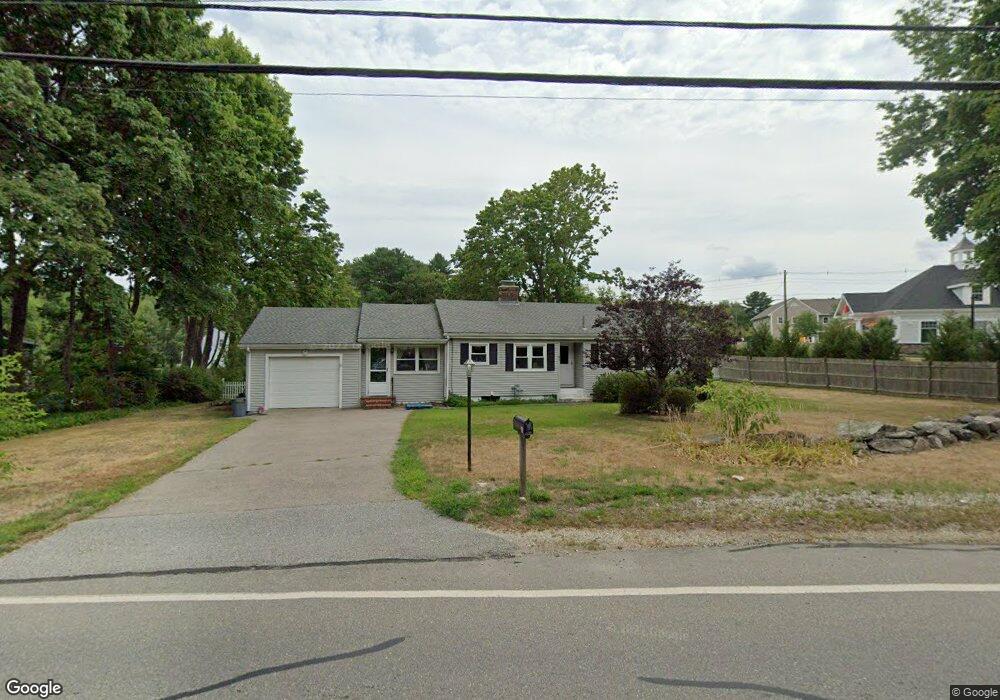
61 Elm St Hopkinton, MA 01748
Estimated Value: $624,000 - $686,000
3
Beds
2
Baths
1,292
Sq Ft
$510/Sq Ft
Est. Value
About This Home
This home is located at 61 Elm St, Hopkinton, MA 01748 and is currently estimated at $659,290, approximately $510 per square foot. 61 Elm St is a home located in Middlesex County with nearby schools including Elmwood Elementary School, Hopkins Elementary School, and Marathon Elementary School.
Ownership History
Date
Name
Owned For
Owner Type
Purchase Details
Closed on
Aug 21, 2019
Sold by
Coco Bella Llc
Bought by
Moore Brian and Tangutoori Shifalika
Current Estimated Value
Home Financials for this Owner
Home Financials are based on the most recent Mortgage that was taken out on this home.
Original Mortgage
$309,000
Outstanding Balance
$270,627
Interest Rate
3.7%
Mortgage Type
New Conventional
Estimated Equity
$388,663
Purchase Details
Closed on
Aug 26, 2008
Sold by
Deutsche Bank Natl T C
Bought by
Coco Bella Llc
Purchase Details
Closed on
Aug 4, 2008
Sold by
Mooar Jon and Deutsche Bank Natl T C
Bought by
Deutsche Bank Natl T C
Purchase Details
Closed on
Oct 26, 2004
Sold by
Kimball Dorothy I
Bought by
Mooar Jon E
Home Financials for this Owner
Home Financials are based on the most recent Mortgage that was taken out on this home.
Original Mortgage
$239,920
Interest Rate
5.85%
Mortgage Type
Purchase Money Mortgage
Create a Home Valuation Report for This Property
The Home Valuation Report is an in-depth analysis detailing your home's value as well as a comparison with similar homes in the area
Home Values in the Area
Average Home Value in this Area
Purchase History
| Date | Buyer | Sale Price | Title Company |
|---|---|---|---|
| Moore Brian | $390,000 | -- | |
| Coco Bella Llc | $254,000 | -- | |
| Deutsche Bank Natl T C | $263,000 | -- | |
| Mooar Jon E | $299,900 | -- |
Source: Public Records
Mortgage History
| Date | Status | Borrower | Loan Amount |
|---|---|---|---|
| Open | Moore Brian | $309,000 | |
| Previous Owner | Mooar Jon E | $239,920 |
Source: Public Records
Tax History Compared to Growth
Tax History
| Year | Tax Paid | Tax Assessment Tax Assessment Total Assessment is a certain percentage of the fair market value that is determined by local assessors to be the total taxable value of land and additions on the property. | Land | Improvement |
|---|---|---|---|---|
| 2025 | $7,374 | $520,000 | $256,600 | $263,400 |
| 2024 | $7,245 | $495,900 | $244,200 | $251,700 |
| 2023 | $6,974 | $441,100 | $214,400 | $226,700 |
| 2022 | $6,843 | $401,800 | $194,700 | $207,100 |
| 2021 | $6,636 | $388,500 | $188,900 | $199,600 |
| 2020 | $6,075 | $361,200 | $184,500 | $176,700 |
| 2019 | $5,807 | $338,200 | $180,900 | $157,300 |
| 2018 | $5,481 | $324,300 | $172,100 | $152,200 |
| 2017 | $5,309 | $316,000 | $167,100 | $148,900 |
| 2016 | $5,250 | $308,300 | $163,800 | $144,500 |
| 2015 | $5,243 | $291,900 | $159,000 | $132,900 |
Source: Public Records
Map
Nearby Homes