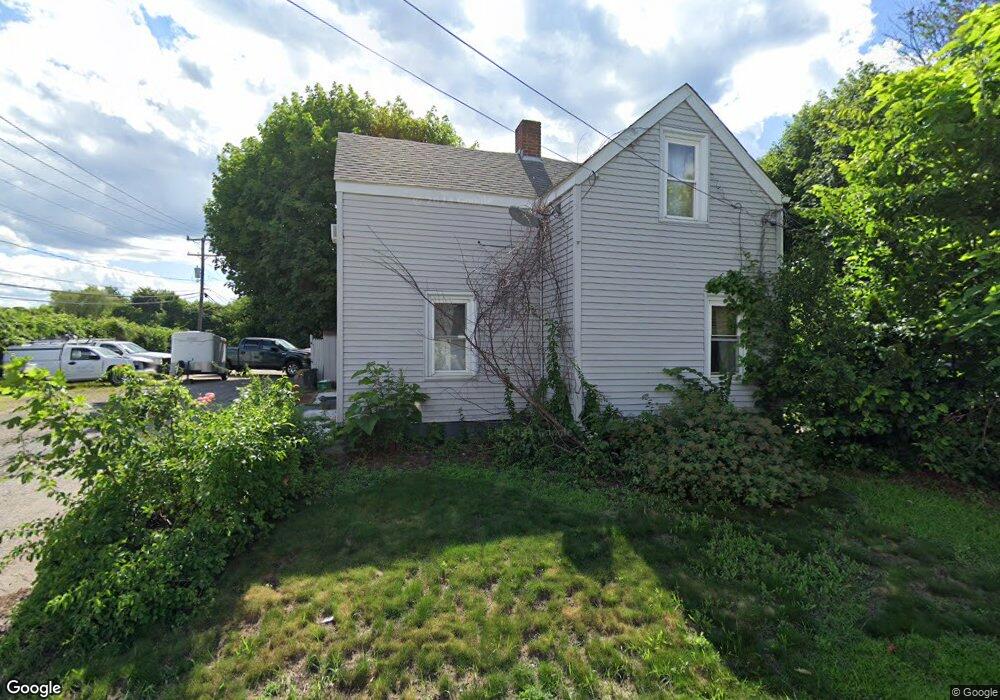
61 Elm St Johnston, RI 02919
Killingly Street NeighborhoodEstimated Value: $327,000 - $346,000
2
Beds
1
Bath
990
Sq Ft
$342/Sq Ft
Est. Value
About This Home
This home is located at 61 Elm St, Johnston, RI 02919 and is currently estimated at $338,212, approximately $341 per square foot. 61 Elm St is a home located in Providence County with nearby schools including Johnston Senior High School, Achievement First Promesa, and Achievement First Providence Mayoral Academy Elementary.
Ownership History
Date
Name
Owned For
Owner Type
Purchase Details
Closed on
Apr 9, 2009
Sold by
Bank Of New York
Bought by
Magnuski Paul E
Current Estimated Value
Purchase Details
Closed on
Jul 1, 2004
Sold by
Sunshine Dev
Bought by
Coleman Daphne and Reid Thomas
Home Financials for this Owner
Home Financials are based on the most recent Mortgage that was taken out on this home.
Original Mortgage
$139,120
Interest Rate
6.3%
Mortgage Type
Purchase Money Mortgage
Purchase Details
Closed on
Apr 19, 2004
Sold by
Freedline Barney
Bought by
Sunshine Dev
Create a Home Valuation Report for This Property
The Home Valuation Report is an in-depth analysis detailing your home's value as well as a comparison with similar homes in the area
Home Values in the Area
Average Home Value in this Area
Purchase History
| Date | Buyer | Sale Price | Title Company |
|---|---|---|---|
| Magnuski Paul E | $44,000 | -- | |
| Coleman Daphne | $174,000 | -- | |
| Sunshine Dev | $70,000 | -- | |
| Magnuski Paul E | $44,000 | -- | |
| Coleman Daphne | $174,000 | -- | |
| Sunshine Dev | $70,000 | -- |
Source: Public Records
Mortgage History
| Date | Status | Borrower | Loan Amount |
|---|---|---|---|
| Previous Owner | Sunshine Dev | $180,000 | |
| Previous Owner | Sunshine Dev | $139,120 | |
| Previous Owner | Sunshine Dev | $34,780 |
Source: Public Records
Tax History
| Year | Tax Paid | Tax Assessment Tax Assessment Total Assessment is a certain percentage of the fair market value that is determined by local assessors to be the total taxable value of land and additions on the property. | Land | Improvement |
|---|---|---|---|---|
| 2025 | $3,390 | $217,000 | $83,700 | $133,300 |
| 2024 | $3,320 | $217,000 | $83,700 | $133,300 |
| 2023 | $3,320 | $217,000 | $83,700 | $133,300 |
| 2022 | $2,489 | $133,900 | $62,000 | $71,900 |
| 2021 | $3,112 | $133,900 | $62,000 | $71,900 |
| 2018 | $2,722 | $99,000 | $46,200 | $52,800 |
| 2016 | $3,601 | $99,000 | $46,200 | $52,800 |
| 2015 | $2,858 | $98,600 | $42,000 | $56,600 |
| 2014 | $2,268 | $98,600 | $42,000 | $56,600 |
| 2013 | $2,835 | $98,600 | $42,000 | $56,600 |
Source: Public Records
Map
Nearby Homes
Your Personal Tour Guide
Ask me questions while you tour the home.