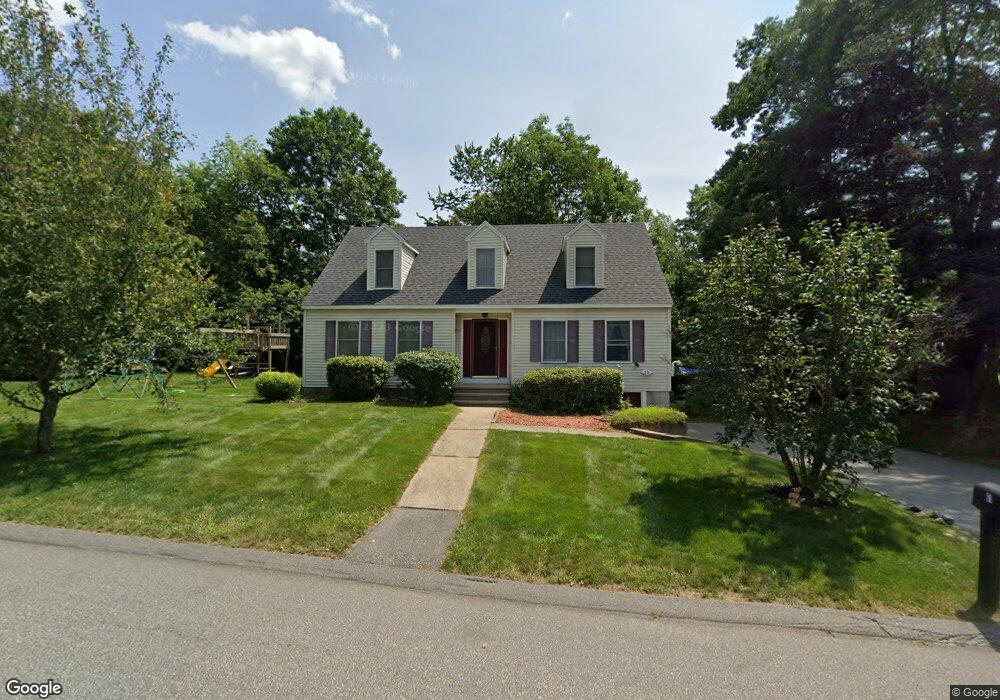
61 Essex St Sanford, ME 04073
Estimated Value: $420,000 - $468,000
3
Beds
2
Baths
2,037
Sq Ft
$216/Sq Ft
Est. Value
About This Home
This home is located at 61 Essex St, Sanford, ME 04073 and is currently estimated at $440,628, approximately $216 per square foot. 61 Essex St is a home located in York County with nearby schools including Sanford Christian Academy and St Thomas Consolidated School.
Ownership History
Date
Name
Owned For
Owner Type
Purchase Details
Closed on
Jul 12, 2005
Sold by
Gorman Linda E and Gorman Richard H
Bought by
Herring Angelica and Herring Joshua J
Current Estimated Value
Home Financials for this Owner
Home Financials are based on the most recent Mortgage that was taken out on this home.
Original Mortgage
$192,900
Outstanding Balance
$99,738
Interest Rate
5.71%
Mortgage Type
Purchase Money Mortgage
Estimated Equity
$340,890
Create a Home Valuation Report for This Property
The Home Valuation Report is an in-depth analysis detailing your home's value as well as a comparison with similar homes in the area
Home Values in the Area
Average Home Value in this Area
Purchase History
| Date | Buyer | Sale Price | Title Company |
|---|---|---|---|
| Herring Angelica | -- | -- | |
| Herring Angelica | -- | -- |
Source: Public Records
Mortgage History
| Date | Status | Borrower | Loan Amount |
|---|---|---|---|
| Open | Herring Angelica | $5,000 | |
| Open | Herring Angelica | $192,900 | |
| Closed | Herring Angelica | $192,900 |
Source: Public Records
Tax History Compared to Growth
Tax History
| Year | Tax Paid | Tax Assessment Tax Assessment Total Assessment is a certain percentage of the fair market value that is determined by local assessors to be the total taxable value of land and additions on the property. | Land | Improvement |
|---|---|---|---|---|
| 2025 | $5,513 | $322,400 | $45,700 | $276,700 |
| 2024 | $5,204 | $322,400 | $45,700 | $276,700 |
| 2023 | $4,840 | $319,700 | $45,700 | $274,000 |
| 2022 | $4,732 | $319,700 | $45,700 | $274,000 |
| 2021 | $4,689 | $257,900 | $45,700 | $212,200 |
| 2020 | $4,459 | $221,200 | $45,700 | $175,500 |
| 2019 | $4,266 | $206,100 | $45,700 | $160,400 |
| 2018 | $4,055 | $197,800 | $45,700 | $152,100 |
| 2017 | $3,694 | $178,100 | $45,700 | $132,400 |
| 2016 | $3,802 | $167,200 | $45,700 | $121,500 |
| 2015 | $3,628 | $174,600 | $46,800 | $127,800 |
| 2014 | $3,559 | $174,600 | $46,800 | $127,800 |
| 2013 | -- | $165,800 | $46,800 | $119,000 |
Source: Public Records
Map
Nearby Homes
- 7 Raymond St
- 27 Avon St
- 1013 Main St
- 126 Jackson St
- 7 Vermont St
- 1 Kempton Terrace
- 37 Weymouth St
- 28 Elm St
- 6 Hewey St
- 54 Malcolm Ave
- 13 Timothy Ln
- 11 Wilson St
- 19 Bodwell St Unit 3
- 19 Bodwell St Unit 5
- 19 Bodwell St Unit 7
- 19 Bodwell St Unit 8
- 19 Bodwell St Unit 4
- 19 Bodwell St Unit 6
- 19 Bodwell St Unit 1
- 19 Bodwell St Unit 2