Estimated Value: $147,000 - $209,000
3
Beds
2
Baths
1,664
Sq Ft
$112/Sq Ft
Est. Value
About This Home
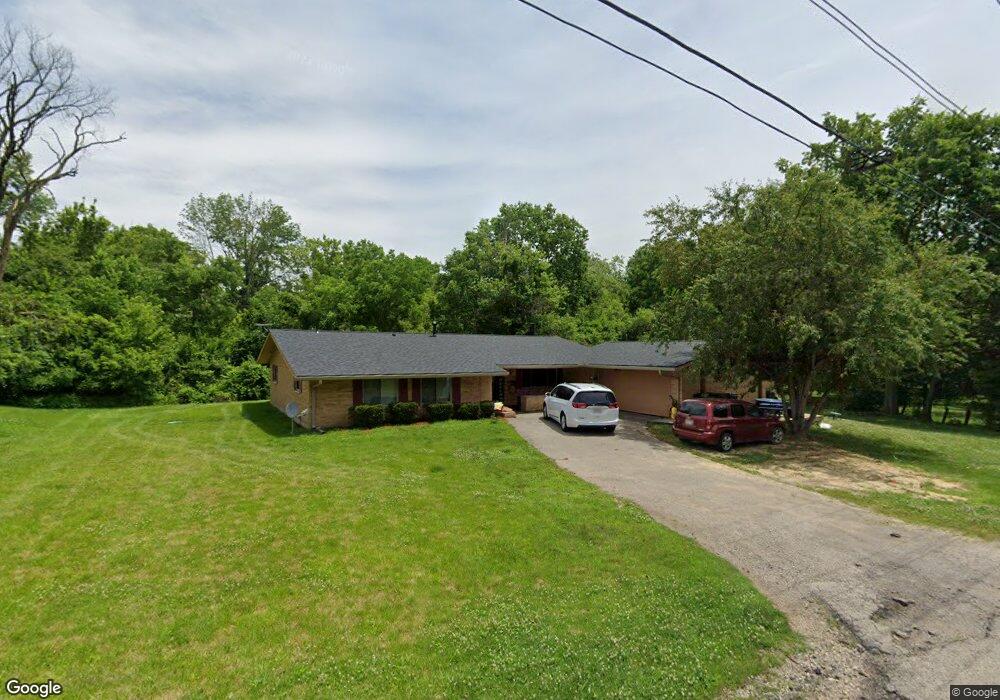
This home is located at 61 Foraker St, Xenia, OH 45385 and is currently estimated at $185,632, approximately $111 per square foot. 61 Foraker St is a home located in Greene County with nearby schools including Xenia High School, Summit Academy Community School for Alternative Learners - Xenia, and Legacy Christian Academy.
Ownership History
Date
Name
Owned For
Owner Type
Purchase Details
Closed on
Apr 23, 2014
Sold by
Finch Consueila and Green Linda K
Bought by
Litje Nicholas R and Litje Candice R
Current Estimated Value
Home Financials for this Owner
Home Financials are based on the most recent Mortgage that was taken out on this home.
Original Mortgage
$88,350
Outstanding Balance
$67,339
Interest Rate
4.41%
Mortgage Type
New Conventional
Estimated Equity
$118,293
Purchase Details
Closed on
May 27, 2008
Sold by
Finch John F and Finch Consuella
Bought by
Finch Consuella and Green Linda
Create a Home Valuation Report for This Property
The Home Valuation Report is an in-depth analysis detailing your home's value as well as a comparison with similar homes in the area
Home Values in the Area
Average Home Value in this Area
Purchase History
| Date | Buyer | Sale Price | Title Company |
|---|---|---|---|
| Litje Nicholas R | $93,000 | None Available | |
| Finch Consuella | -- | Attorney |
Source: Public Records
Mortgage History
| Date | Status | Borrower | Loan Amount |
|---|---|---|---|
| Open | Litje Nicholas R | $88,350 |
Source: Public Records
Tax History Compared to Growth
Tax History
| Year | Tax Paid | Tax Assessment Tax Assessment Total Assessment is a certain percentage of the fair market value that is determined by local assessors to be the total taxable value of land and additions on the property. | Land | Improvement |
|---|---|---|---|---|
| 2024 | $1,858 | $43,420 | $930 | $42,490 |
| 2023 | $1,858 | $43,420 | $930 | $42,490 |
| 2022 | $1,532 | $30,540 | $840 | $29,700 |
| 2021 | $1,553 | $30,540 | $840 | $29,700 |
| 2020 | $1,488 | $30,540 | $840 | $29,700 |
| 2019 | $1,501 | $29,010 | $1,020 | $27,990 |
| 2018 | $1,507 | $29,010 | $1,020 | $27,990 |
| 2017 | $1,464 | $29,010 | $1,020 | $27,990 |
| 2016 | $1,465 | $27,670 | $1,020 | $26,650 |
| 2015 | $1,469 | $27,670 | $1,020 | $26,650 |
| 2014 | $937 | $27,670 | $1,020 | $26,650 |
Source: Public Records
Map
Nearby Homes
- 1293 E Main St
- 0 N Patton St
- 00 N Patton St
- 654 E 3rd St
- 645 E Church St
- 607 E Main St
- 612 E Market St
- 541 E Main St
- 0 Gultice Rd Unit 940427
- 568 Louise Dr
- 656 Eden Roc Dr
- 610 Saxony Dr
- 240 E 2nd St
- 479 N Stadium Dr
- 348 S Stadium Dr
- 373 Hill St
- 508 Marshall Dr
- 513 Redbud Ln
- 222 Washington St
- 119 Park Dr