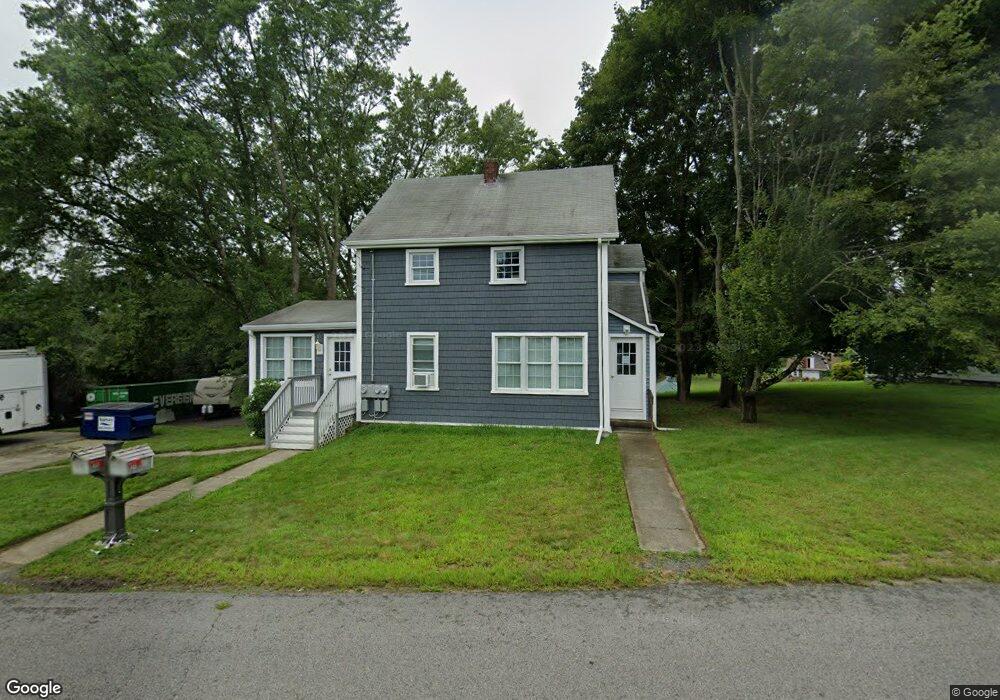
61 Gifford Rd Westport, MA 02790
North Westport NeighborhoodEstimated Value: $303,000 - $450,809
6
Beds
--
Bath
1,342
Sq Ft
$294/Sq Ft
Est. Value
About This Home
This home is located at 61 Gifford Rd, Westport, MA 02790 and is currently estimated at $394,452, approximately $293 per square foot. 61 Gifford Rd is a home located in Bristol County with nearby schools including Alice A. Macomber Primary School, Westport Elementary School, and Westport Middle-High School.
Ownership History
Date
Name
Owned For
Owner Type
Purchase Details
Closed on
Oct 5, 2021
Sold by
Lopes Zachary W Est
Bought by
H & M Rt
Current Estimated Value
Home Financials for this Owner
Home Financials are based on the most recent Mortgage that was taken out on this home.
Original Mortgage
$195,200
Outstanding Balance
$178,004
Interest Rate
2.8%
Mortgage Type
Commercial
Estimated Equity
$216,448
Purchase Details
Closed on
Oct 3, 2021
Sold by
Amaral Christopher L Est
Bought by
H & M Rt
Home Financials for this Owner
Home Financials are based on the most recent Mortgage that was taken out on this home.
Original Mortgage
$195,200
Outstanding Balance
$178,004
Interest Rate
2.8%
Mortgage Type
Commercial
Estimated Equity
$216,448
Purchase Details
Closed on
Dec 17, 2010
Sold by
Amaral Marguerite E and Amaral Margaret E
Bought by
Amaral Christopher L and Amaral Scott L
Create a Home Valuation Report for This Property
The Home Valuation Report is an in-depth analysis detailing your home's value as well as a comparison with similar homes in the area
Home Values in the Area
Average Home Value in this Area
Purchase History
| Date | Buyer | Sale Price | Title Company |
|---|---|---|---|
| H & M Rt | $30,000 | None Available | |
| H & M Rt | $60,000 | None Available | |
| H & M Rt | $90,000 | None Available | |
| Amaral Christopher L | -- | -- |
Source: Public Records
Mortgage History
| Date | Status | Borrower | Loan Amount |
|---|---|---|---|
| Open | H & M Rt | $195,200 | |
| Previous Owner | Amaral Christopher L | $4,885 | |
| Previous Owner | Amaral Christopher L | $10,000 |
Source: Public Records
Tax History Compared to Growth
Tax History
| Year | Tax Paid | Tax Assessment Tax Assessment Total Assessment is a certain percentage of the fair market value that is determined by local assessors to be the total taxable value of land and additions on the property. | Land | Improvement |
|---|---|---|---|---|
| 2025 | $2,470 | $331,500 | $168,800 | $162,700 |
| 2024 | $2,406 | $311,300 | $149,900 | $161,400 |
| 2023 | $2,215 | $271,400 | $136,600 | $134,800 |
| 2022 | $1,990 | $255,000 | $136,600 | $118,400 |
| 2021 | $1,990 | $230,900 | $112,900 | $118,000 |
| 2020 | $1,909 | $226,400 | $108,400 | $118,000 |
| 2019 | $1,875 | $226,700 | $108,400 | $118,300 |
| 2018 | $1,654 | $202,500 | $109,600 | $92,900 |
| 2017 | $1,568 | $196,800 | $106,100 | $90,700 |
| 2016 | $1,529 | $193,300 | $102,600 | $90,700 |
| 2015 | $1,439 | $181,400 | $104,900 | $76,500 |
Source: Public Records
Map
Nearby Homes
- 116 Gifford Rd
- 23 Donna St
- 9 Kyle Jacob Rd
- 100 D Dr
- 0 Van Buren St
- 15 S Breault St
- 16 S Berryman St
- 3 Diane Way
- 9 Register Ave
- 565 Highland Ave
- 92 Benoit St
- 1276 Old Fall River Rd
- 33 William St
- 771 Sanford Rd
- 6 Beaulieu St
- 25 Beaulieu St
- 27 Dias Ave
- 19 Charles Joseph Dr
- 2 Donna Marie Dr
- 128 Old Bedford Rd