Estimated Value: $350,000 - $384,000
4
Beds
3
Baths
1,808
Sq Ft
$204/Sq Ft
Est. Value
About This Home
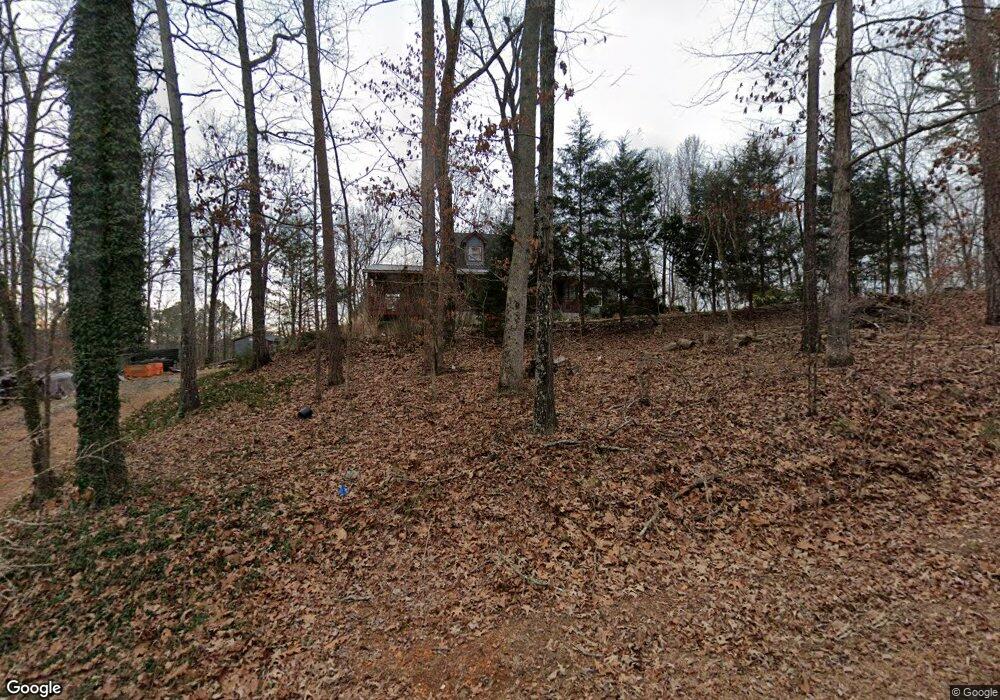
This home is located at 61 Hale Mountain Ct, Hiram, GA 30141 and is currently estimated at $368,278, approximately $203 per square foot. 61 Hale Mountain Ct is a home located in Paulding County with nearby schools including Sam D. Panter Elementary School, J. A. Dobbins Middle School, and Hiram High School.
Ownership History
Date
Name
Owned For
Owner Type
Purchase Details
Closed on
Mar 19, 1999
Sold by
Herrington Clyde A and Herrington Sharon R
Bought by
Payne Paul P and Payne Geraldine L
Current Estimated Value
Home Financials for this Owner
Home Financials are based on the most recent Mortgage that was taken out on this home.
Original Mortgage
$99,750
Outstanding Balance
$24,121
Interest Rate
6.74%
Mortgage Type
New Conventional
Estimated Equity
$344,157
Purchase Details
Closed on
Jan 29, 1998
Sold by
Contimortgage Corp
Bought by
Herrington Clyde A
Home Financials for this Owner
Home Financials are based on the most recent Mortgage that was taken out on this home.
Original Mortgage
$68,600
Interest Rate
7.01%
Mortgage Type
New Conventional
Purchase Details
Closed on
Aug 5, 1997
Sold by
Steele Roger L
Bought by
Conti Mortgage Corp
Purchase Details
Closed on
May 2, 1994
Sold by
Milo Corp Inc
Bought by
Pagiorkowski Tammy
Purchase Details
Closed on
Nov 9, 1992
Sold by
Cole Jewell E
Bought by
Milo Corp
Create a Home Valuation Report for This Property
The Home Valuation Report is an in-depth analysis detailing your home's value as well as a comparison with similar homes in the area
Home Values in the Area
Average Home Value in this Area
Purchase History
| Date | Buyer | Sale Price | Title Company |
|---|---|---|---|
| Payne Paul P | $105,000 | -- | |
| Herrington Clyde A | $85,800 | -- | |
| Conti Mortgage Corp | $99,000 | -- | |
| Pagiorkowski Tammy | $18,000 | -- | |
| Milo Corp | $2,000 | -- |
Source: Public Records
Mortgage History
| Date | Status | Borrower | Loan Amount |
|---|---|---|---|
| Open | Payne Paul P | $99,750 | |
| Previous Owner | Herrington Clyde A | $68,600 |
Source: Public Records
Tax History Compared to Growth
Tax History
| Year | Tax Paid | Tax Assessment Tax Assessment Total Assessment is a certain percentage of the fair market value that is determined by local assessors to be the total taxable value of land and additions on the property. | Land | Improvement |
|---|---|---|---|---|
| 2024 | $900 | $133,524 | $33,080 | $100,444 |
| 2023 | $1,003 | $126,600 | $32,240 | $94,360 |
| 2022 | $1,785 | $110,884 | $26,760 | $84,124 |
| 2021 | $1,581 | $87,164 | $20,920 | $66,244 |
| 2020 | $1,474 | $79,280 | $19,760 | $59,520 |
| 2019 | $1,397 | $74,000 | $20,920 | $53,080 |
| 2018 | $1,268 | $68,044 | $20,360 | $47,684 |
| 2017 | $1,833 | $61,880 | $19,520 | $42,360 |
| 2016 | $1,621 | $55,476 | $19,520 | $35,956 |
| 2015 | $1,575 | $53,040 | $19,160 | $33,880 |
| 2014 | $1,460 | $48,124 | $17,600 | $30,524 |
| 2013 | -- | $44,240 | $19,280 | $24,960 |
Source: Public Records
Map
Nearby Homes
- 650 Davis Rd
- 113 Hale Mountain Ct
- 60 Hale Mountain Ct
- 538 Davis Rd
- 185 Hale Mountain Ct
- 541 Davis Rd
- 130 Hale Mountain Ct
- 180 Hale Mountain Ct
- 645 Davis Rd
- 217 Hale Mountain Ct
- 46 Davis Rd
- 404 Davis Rd
- 463 Davis Rd
- 255 Hale Mountain Ct
- 404 Lynn Dr
- 350 Riverstone Dr
- 385 Davis Rd
- 410 Lynn Dr
- 278 Hale Mountain Ct
- 347 Riverstone Dr